Commodities
Charted: Commodities vs Equity Valuations (1970–2023)
![]() Subscribe to the Elements free mailing list for more like this
Subscribe to the Elements free mailing list for more like this
Charted: Commodities vs Equity Valuations (1970–2023)
This was originally posted on Elements. Sign up to the free mailing list to get beautiful visualizations on natural resource megatrends in your email every week.
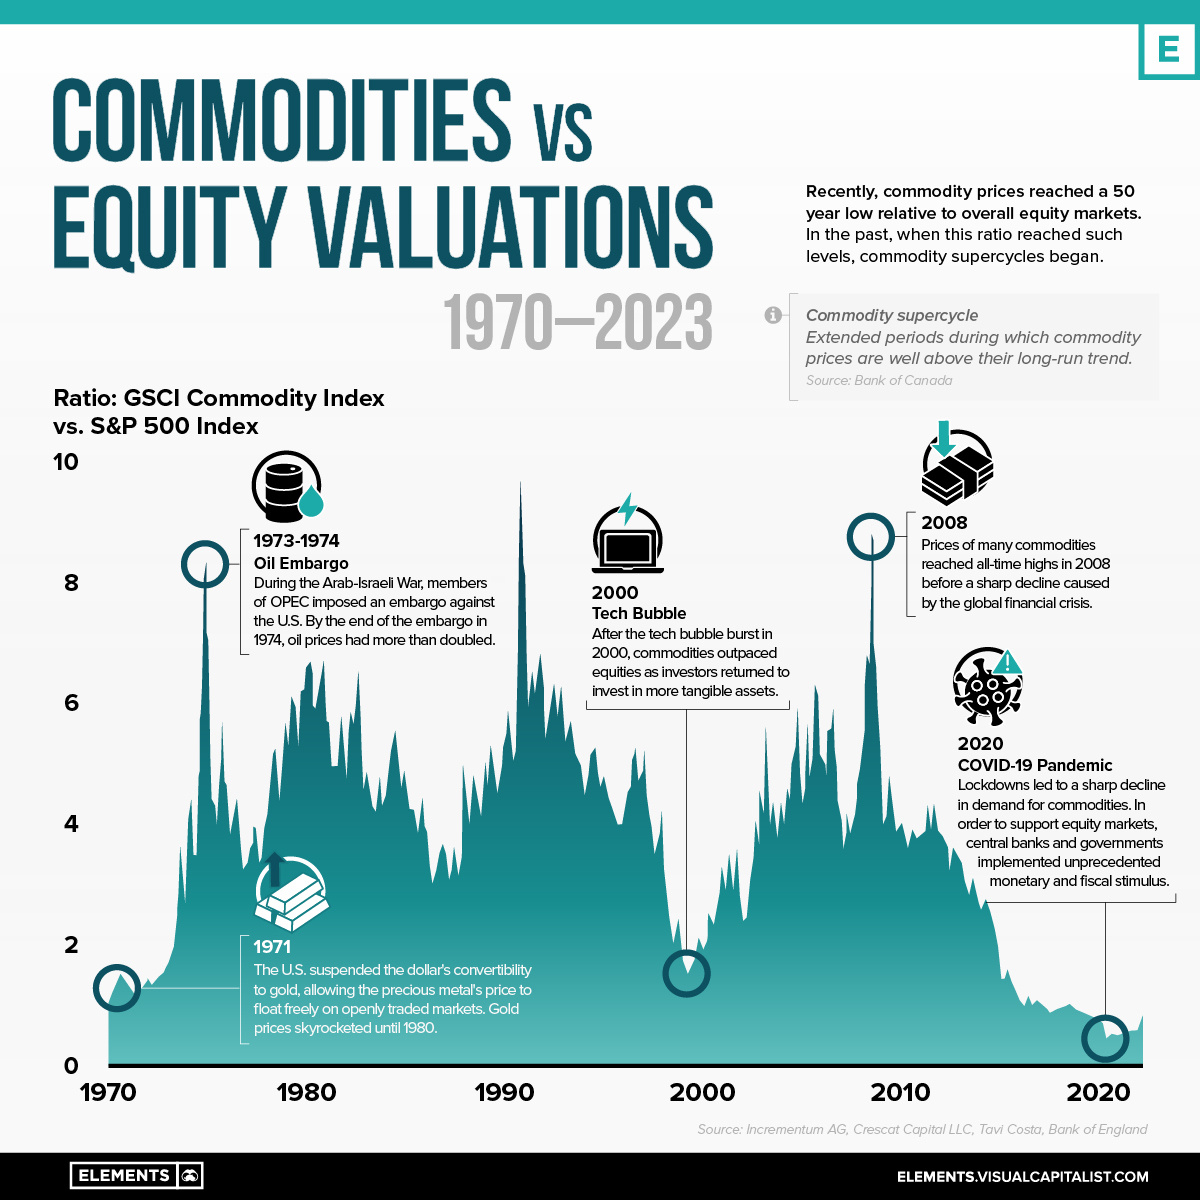
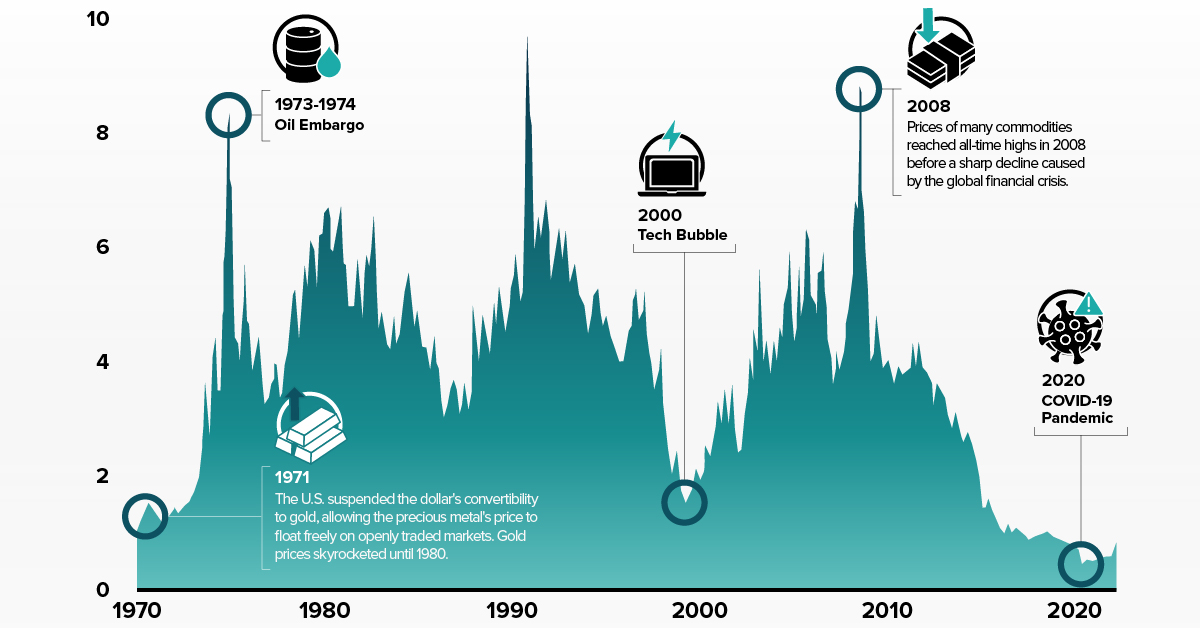
In recent years, commodity prices have reached a 50-year low relative to overall equity markets (S&P 500). Historically, lows in the ratio of commodities to equities have corresponded with the beginning of new commodity supercycles.
The infographic above uses data from Incrementum AG and Crescat Capital LLC to show the relationship between commodities and U.S. equities over the last five decades.
What is a Commodity Supercycle?
A commodity supercycle occurs when prices of commodities rise above their long-term averages for long periods of time, even decades. Once the supply has adequately grown to meet demand, the cycle enters a downswing.
The last commodity supercycle started in 1996 and peaked in 2011, driven by raw material demand from rapid industrialization taking place in Brazil, India, Russia, and China.
| Supercycles in Commodity Prices | 1899-1932 | 1933-1961 | 1962-1995 | 1996-2016 |
|---|---|---|---|---|
| Peak year | 1904 | 1947 | 1978 | 2011 |
| Peak of supercycle from long-term trend (%) | 10.2 | 14.1 | 19.5 | 33.5 |
| Trough of supercycle from long-term trend (%) | -12.9 | -10 | -38.1 | 23.7 |
| Length of cycle from trough-to-trough (years) | 33 | 29 | 34 | 20 |
| Upswing (years) | 5 | 15 | 17 | 16 |
| Downswing (years) | 28 | 14 | 17 | 4 |
Source: Bank of Canada, IHS
While no two supercycles look the same, they all have three indicators in common: a surge in supply, a surge in demand, and a surge in price.
In general, commodity prices and equity valuations tend to have a low to negative correlation, making it rare to see the two moving in tandem in the same direction for any long period of time.
Commodity Prices and Equity Valuations
In line with the above notion, commodity prices and equity valuations have often been at odds with one another in past market cycles.
During the 1970s and early 1980s, for example, rising oil prices led to a significant decline in stock prices as higher energy costs hurt corporate profits. In contrast, during the first half of the 2000s, low oil prices were accompanied by a strong equity bull market that ended with the 2008 stock market crash.
The relationship, however, is not always straightforward and can be affected by various other factors, such as global economic growth, supply and demand, inflation, and other market events.
With the most recent commodity supercycle peaking in 2011, could the next big one be right around the corner?


Economy
Charted: Top Destinations for Africa’s Exports (1995-2020)
In 2020 the African continent exported nearly $378 billion worth of goods. Here are the top destinations for 25 years of Africa’s exports.
 Creator Program
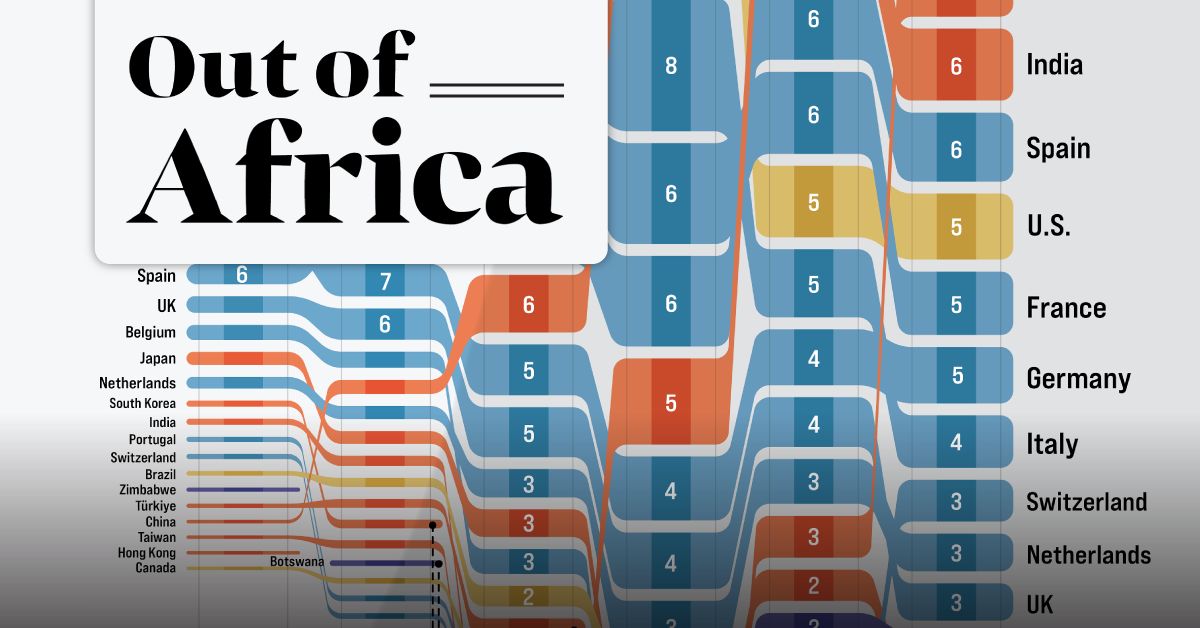
Charted: Top Destinations for Africa’s Exports (1995-2020)
Just under 30 years ago, exports originating from countries in Africa sat at $106 billion annually, primarily going to nations in the West. By 2020, Africa’s exports had more than tripled, but now with Asia as the primary destination.
The world’s second-largest continent, much of the value of Africa’s exports are concentrated in natural resources like petroleum, gold, diamonds, natural gas, and coal. Agricultural commodities like tea, coffee, and cotton also find large markets overseas.
Which countries are the top destinations for Africa’s exports?
This graphic from Sebastian Gräff uses data from Harvard University’s Atlas of Economic Complexity, the World Bank, and Bloomberg to track total exports from African countries over the years. Countries receiving a 1% or greater share of total exports have been included, and percentages have been rounded.
Tracking Africa’s Exports Between 1995 and 2005
The U.S. was the top destination for African goods for many years, led by the country’s demand for petroleum products. At its peak in 2005, the U.S. received one-fifth of the continent’s exports, valued at $55 billion.
Here’s a look at all the countries that had a 1% or greater share of Africa’s total export value at some point from 1995 to 2005.
| Country | Region | 1995 | 2000 | 2005 |
|---|---|---|---|---|
| 🇺🇸 U.S. | North America | 14% | 18% | 20% |
| 🇮🇹 Italy | Europe | 11% | 9% | 8% |
| 🇫🇷 France | Europe | 11% | 8% | 7% |
| 🇩🇪 Germany | Europe | 8% | 7% | 5% |
| 🇪🇸 Spain | Europe | 6% | 7% | 7% |
| 🇬🇧 UK | Europe | 5% | 6% | 5% |
| 🇧🇪 Belgium | Europe | 5% | 3% | 3% |
| 🇯🇵 Japan | Asia | 4% | 3% | 3% |
| 🇳🇱 Netherlands | Europe | 3% | 3% | 3% |
| 🇰🇷 South Korea | Asia | 2% | 2% | 1% |
| 🇮🇳 India | Asia | 2% | 2% | 1% |
| 🇵🇹 Portugal | Europe | 2% | 1% | 1% |
| 🇨🇳 China | Asia | 1% | 3% | 6% |
| 🇧🇷 Brazil | South America | 1% | 2% | 2% |
| 🇹🇷 Turkiye | Asia | 1% | 2% | 2% |
| 🇨🇦 Canada | North America | 1% | 1% | 2% |
| 🇨🇭 Switzerland | Europe | 1% | 1% | 1% |
| 🇿🇼 Zimbabwe | Africa | 1% | 1% | 1% |
| 🇹🇼 Taiwan | Asia | 1% | 2% | 1% |
| 🇸🇦 Saudi Arabia | Asia | 1% | 1% | 1% |
| 🇿🇦 South Africa | Africa | 1% | 0% | 1% |
| 🇨🇮 Côte d'Ivoire | Africa | 1% | 1% | 1% |
| 🇭🇰 Hong Kong | Asia | 1% | 0% | 0% |
| 🇦🇹 Austria | Europe | 1% | 0% | 0% |
| 🇬🇷 Greece | Europe | 1% | 1% | 0% |
| 🇹🇭 Thailand | Asia | 1% | 0% | 0% |
| 🇸🇬 Singapore | Asia | 1% | 0% | 0% |
| 🇲🇿 Mozambique | Africa | 1% | 1% | 0% |
| 🇹🇳 Tunisia | Africa | 1% | 0% | 0% |
| 🇮🇩 Indonesia | Asia | 1% | 1% | 0% |
| 🇳🇬 Nigeria | Africa | 0% | 0% | 1% |
| 🇦🇺 Australia | Oceania | 0% | 0% | 1% |
| 🇧🇼 Botswana | Africa | N/A | 1% | 1% |
| 🇳🇦 Namibia | Africa | N/A | 1% | 1% |
| 🇸🇿 Eswatini | Africa | N/A | 1% | 0% |
| 🇿🇲 Zambia | Africa | N/A | 1% | 0% |
Western European countries—Italy, France, Spain, Germany, Belgium and the UK—also accounted for a significant share of Africa’s exports throughout this time period. Part of this was due to century-old relationships and colonial legacies, but trade was also encouraged by initiatives like the 1976 Lomé Convention, which gave products from developing African countries (particularly former colonies) duty-free access to European markets in exchange for developmental aid.
During the mid-2000s, China also started to take up a growing share of the continent’s exports, as its rapid industrialization led to skyrocketing demand for commodities such as oil, iron ore, and copper—all key African exports.
Asia’s Growing Export Share Between 2010 and 2020
By the year 2010, as African exports topped the $481 billion per year mark, the global market was rapidly starting to change.
For starters, thanks to a considerable increase in domestic oil and natural gas production, the United States began cutting back on African petroleum imports.
At the same time, China had been actively seeking resources and investment opportunities in the developing world as part of its greater geopolitical strategy. By 2015, it had surpassed the U.S. as Africa’s primary export destination, marking a shift in the continent’s trade dynamics.
Here’s a look at all the countries with a 1% or greater share of Africa’s total export value from 2010 to 2020.
| Country | Region | 2010 | 2015 | 2020 |
|---|---|---|---|---|
| 🇺🇸 U.S. | North America | 15% | 5% | 5% |
| 🇨🇳 China | Asia | 11% | 12% | 15% |
| 🇮🇹 Italy | Europe | 8% | 5% | 4% |
| 🇪🇸 Spain | Europe | 6% | 6% | 6% |
| 🇫🇷 France | Europe | 6% | 6% | 5% |
| 🇮🇳 India | Asia | 5% | 7% | 6% |
| 🇩🇪 Germany | Europe | 4% | 4% | 5% |
| 🇬🇧 UK | Europe | 4% | 4% | 3% |
| 🇳🇱 Netherlands | Europe | 3% | 3% | 3% |
| 🇯🇵 Japan | Asia | 2% | 2% | 2% |
| 🇧🇪 Belgium | Europe | 2% | 2% | 2% |
| 🇿🇦 South Africa | Africa | 2% | 2% | 2% |
| 🇧🇷 Brazil | South America | 2% | 2% | 1% |
| 🇨🇦 Canada | North America | 2% | 1% | 1% |
| 🇦🇪 UAE | Asia | 1% | 3% | 6% |
| 🇨🇭 Switzerland | Europe | 1% | 2% | 3% |
| 🇹🇷 Turkiye | Asia | 1% | 1% | 2% |
| 🇵🇹 Portugal | Europe | 1% | 1% | 1% |
| 🇰🇷 South Korea | Asia | 1% | 1% | 1% |
| 🇧🇼 Botswana | Africa | 1% | 1% | 1% |
| 🇳🇦 Namibia | Africa | 1% | 1% | 1% |
| 🇿🇲 Zambia | Africa | 1% | 1% | 1% |
| 🇸🇦 Saudi Arabia | Asia | 1% | 1% | 1% |
| 🇬🇷 Greece | Europe | 1% | 0% | 1% |
| 🇦🇺 Australia | Oceania | 1% | 0% | 1% |
| 🇿🇼 Zimbabwe | Africa | 1% | 1% | 1% |
| 🇲🇾 Malaysia | Asia | 1% | 1% | 1% |
| 🇨🇩 DRC | Africa | 1% | 1% | 1% |
| 🇹🇼 Taiwan | Asia | 1% | 1% | 0% |
| 🇳🇬 Nigeria | Africa | 1% | 1% | 0% |
| 🇨🇮 Côte d'Ivoire | Africa | 1% | 1% | 0% |
| 🇮🇩 Indonesia | Asia | 0% | 1% | 1% |
| 🇲🇿 Mozambique | Africa | 0% | 1% | 1% |
| 🇭🇰 Hong Kong | Asia | 0% | 1% | 1% |
| 🇸🇬 Singapore | Asia | 0% | 0% | 1% |
| 🇹🇭 Thailand | Asia | 0% | 0% | 1% |
| 🇻🇳 Vietnam | Asia | 0% | 0% | 1% |
| 🇷🇺 Russia | Europe | 0% | 0% | 1% |
| 🇵🇰 Pakistan | Asia | 0% | 0% | 1% |
| 🇵🇱 Poland | Europe | 0% | 0% | 1% |
| 🇺🇬 Uganda | Asia | 0% | 0% | 1% |
China was joined in the top three ranks by India and the UAE, who were also experiencing rapid industrialization and growing demand for African commodities. In 2020, nearly 40% of Africa’s exports found a market in Asia, led by China and India’s significant trade volumes.
In comparison, Western Europe had started relinquish both its share and value of African goods imported. Alongside growing demand from developing countries, there became greater diversification in African export markets, with countries from Asia (Malaysia, Pakistan), Eastern Europe (Poland, Russia), and within Africa (the Democratic Republic of the Congo, Uganda), accounting for growing shares of African exports.
The Future of the African Export Market
Though Africa’s largest export markets are outside the continent for now, there is vast untapped potential for inter-regional exports, which stood at only 15% of total export value in 2020.
There is movement to expand on this trade, with the African Continental Free Trade Area (AfCFTA) established in 2018 to reduce trade barriers between African countries. According to UN estimates, it has the potential to create a $3 trillion market within the continent alone.
With one of the fastest-growing regional populations, the African continent’s economic stakes have never been higher. So who will end up dominating Africa’s trade landscape in the decades to come?
 |
WINNER: The 2023 Creator Program Challenge
Winners of our Creator Program Challenges receive their own ambassador badge, prize money, and become a trusted creator on Visual Capitalist. For all results from the 2023 Creator Program Challenge, click here to check out the year’s shortlist winners. |

-

 Markets2 weeks ago
Visualizing 1 Billion Square Feet of Empty Office Space
-

 Energy4 weeks ago
Life Cycle Emissions: EVs vs. Combustion Engine Vehicles
-

 Maps2 weeks ago
Vintage Viz: The World’s Rivers and Lakes, Organized Neatly
-

 Finance3 weeks ago
Visualized: The 100 Largest U.S. Banks by Consolidated Assets
-

 Automation1 week ago
Charted: Changing Sentiments Towards AI in the Workplace
-

 VC+3 weeks ago
What are Top Investment Managers Holding in Their Portfolios?
-

 Stocks1 week ago
The 50 Best One-Year Returns on the S&P 500 (1980-2022)
-

 United States3 weeks ago
Chart: U.S. Home Price Growth Over 50 Years