Markets
Ranked: The 100 Biggest Public Companies in the World
View the full-resolution version of this infographic.


The Biggest Companies in the World in 2022
View the high-resolution of the infographic by clicking here.
This year has been shaped by uncomfortable macroeconomic headwinds.
Trillions of dollars were erased in public company market capitalizations, investor confidence waned, and cost pressures squeezed consumer pocketbooks.
Taken together, many of the world’s largest companies experienced sharp declines in market share. Still, a few companies in key sectors had positive growth over the year.
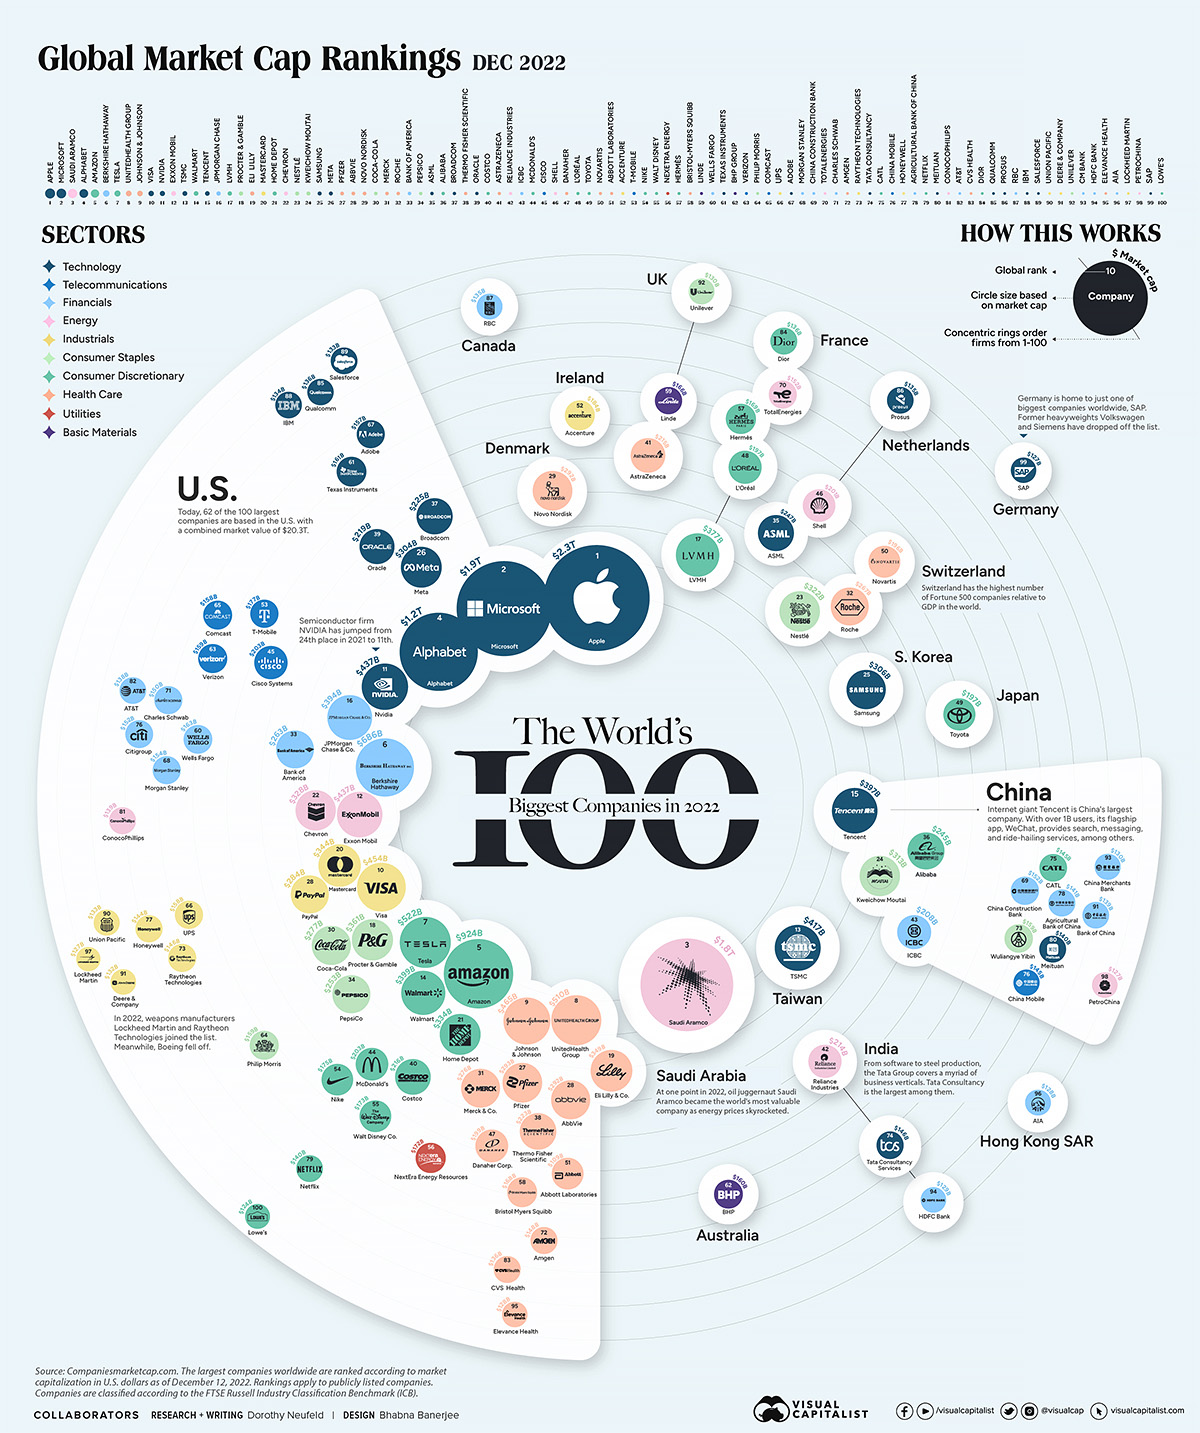
As 2022 comes to a close, the above infographic shows the biggest companies in the world, using data from Companiesmarketcap.com.
The World’s Largest Public Companies in 2022
Today, Apple stands as the world’s most valuable company, towering at a $2.3 trillion valuation.
Despite the tech downturn of 2022—driven by rising interest rates and slower sales—Apple maintained its top spot. This was largely thanks to record revenues and healthy consumer demand for iPhones, which drive about half of its total revenue.
Following Apple is Microsoft. Unlike Apple, Microsoft has faced slower earnings over the year due to lower demand for personal computers and the weighing impact of a strong U.S. dollar. Overall, about 50% of the company’s sales take place overseas.
As we show below, there are now only four companies left in the trillion dollar market cap club.
| 2022 Rank | Company | Market Capitalization | Sector | Location |
|---|---|---|---|---|
| 1 | Apple | $2.3T | Technology | 🇺🇸 U.S. |
| 2 | Microsoft | $1.9T | Technology | 🇺🇸 U.S. |
| 3 | Saudi Aramco | $1.8T | Energy | 🇸🇦 Saudi Arabia |
| 4 | Alphabet | $1.2T | Technology | 🇺🇸 U.S. |
| 5 | Amazon | $924B | Consumer Discretionary | 🇺🇸 U.S. |
| 6 | Berkshire Hathaway | $686B | Financials | 🇺🇸 U.S. |
| 7 | Tesla | $522B | Consumer Discretionary | 🇺🇸 U.S. |
| 8 | UnitedHealth Group | $510B | Health Care | 🇺🇸 U.S. |
| 9 | Johnson & Johnson | $465B | Health Care | 🇺🇸 U.S. |
| 10 | Visa | $454B | Industrials | 🇺🇸 U.S. |
| 11 | NVIDIA | $437B | Technology | 🇺🇸 U.S. |
| 12 | Exxon Mobil | $437B | Energy | 🇺🇸 U.S. |
| 13 | TSMC | $417B | Technology | 🇹🇼 Taiwan |
| 14 | Walmart | $399B | Consumer Discretionary | 🇺🇸 U.S. |
| 15 | Tencent | $397B | Technology | 🇨🇳 China |
| 16 | JPMorgan Chase | $394B | Financials | 🇺🇸 U.S. |
| 17 | LVMH | $377B | Consumer Discretionary | 🇫🇷 France |
| 18 | Procter & Gamble | $361B | Consumer Staples | 🇺🇸 U.S. |
| 19 | Eli Lilly | $349B | Health Care | 🇺🇸 U.S. |
| 20 | Mastercard | $344B | Industrials | 🇺🇸 U.S. |
| 21 | Home Depot | $334B | Consumer Discretionary | 🇺🇸 U.S. |
| 22 | Chevron | $328B | Energy | 🇺🇸 U.S. |
| 23 | Nestlé | $322B | Consumer Staples | 🇨🇭 Switzerland |
| 24 | Kweichow Moutai | $313B | Consumer Staples | 🇨🇳 China |
| 25 | Samsung | $306B | Technology | 🇰🇷 South Korea |
| 26 | Meta (Facebook) | $304B | Technology | 🇺🇸 U.S. |
| 27 | Pfizer | $293B | Health Care | 🇺🇸 U.S. |
| 28 | AbbVie | $292B | Health Care | 🇺🇸 U.S. |
| 29 | Novo Nordisk | $292B | Health Care | 🇩🇰 Denmark |
| 30 | Coca-Cola | $277B | Consumer Staples | 🇺🇸 U.S. |
| 31 | Merck | $276B | Health Care | 🇺🇸 U.S. |
| 32 | Roche | $267B | Health Care | 🇨🇭 Switzerland |
| 33 | Bank of America | $263B | Financials | 🇺🇸 U.S. |
| 34 | Pepsico | $253B | Consumer Staples | 🇺🇸 U.S. |
| 35 | ASML | $247B | Technology | 🇳🇱 Netherlands |
| 36 | Alibaba | $245B | Consumer Discretionary | 🇨🇳 China |
| 37 | Broadcom | $225B | Technology | 🇺🇸 U.S. |
| 38 | Thermo Fisher Scientific | $223B | Health Care | 🇺🇸 U.S. |
| 39 | Oracle | $219B | Technology | 🇺🇸 U.S. |
| 40 | Costco | $216B | Consumer Discretionary | 🇺🇸 U.S. |
| 41 | Astrazeneca | $215B | Health Care | 🇬🇧 United Kingdom |
| 42 | Reliance Industries | $214B | Energy | 🇮🇳 India |
| 43 | ICBC | $208B | Financials | 🇨🇳 China |
| 44 | McDonald's | $203B | Consumer Discretionary | 🇺🇸 U.S. |
| 45 | Cisco | $203B | Telecommunications | 🇺🇸 U.S. |
| 46 | Shell | $201B | Energy | 🇳🇱 Netherlands |
| 47 | Danaher | $199B | Health Care | 🇺🇸 U.S. |
| 48 | L'Oréal | $197B | Consumer Discretionary | 🇫🇷 France |
| 49 | Toyota | $197B | Consumer Discretionary | 🇯🇵 Japan |
| 50 | Novartis | $196B | Health Care | 🇨🇭 Switzerland |
| 51 | Abbott Laboratories | $109B | Health Care | 🇺🇸 U.S. |
| 52 | Accenture | $184B | Industrials | 🇮🇪 Ireland |
| 53 | T-Mobile | $177B | Telecommunications | 🇺🇸 U.S. |
| 54 | Nike | $175B | Consumer Discretionary | 🇺🇸 U.S. |
| 55 | Walt Disney | $173B | Consumer Discretionary | 🇺🇸 U.S. |
| 56 | Nextera Energy | $172B | Utilities | 🇺🇸 U.S. |
| 57 | Hermès | $169B | Consumer Discretionary | 🇫🇷 France |
| 58 | Bristol-Myers Squibb | $168B | Health Care | 🇺🇸 U.S. |
| 59 | Linde | $166B | Basic Materials | 🇬🇧 United Kingdom |
| 60 | Wells Fargo | $163B | Financials | 🇺🇸 U.S. |
| 61 | Texas Instruments | $161B | Technology | 🇺🇸 U.S. |
| 62 | BHP Group | $160B | Basic Materials | 🇦🇺 Australia |
| 63 | Verizon | $159B | Telecommunications | 🇺🇸 U.S. |
| 64 | Philip Morris | $159B | Consumer Staples | 🇺🇸 U.S. |
| 65 | Comcast | $158B | Telecommunications | 🇺🇸 U.S. |
| 66 | UPS | $158B | Industrials | 🇺🇸 U.S. |
| 67 | Adobe | $157B | Technology | 🇺🇸 U.S. |
| 68 | Morgan Stanley | $154B | Financials | 🇺🇸 U.S. |
| 69 | China Construction Bank | $152B | Financials | 🇨🇳 China |
| 70 | TotalEnergies | $152B | Energy | 🇫🇷 France |
| 71 | Charles Schwab | $150B | Financials | 🇺🇸 U.S. |
| 72 | Amgen | $148B | Health Care | 🇺🇸 U.S. |
| 73 | Raytheon Technologies | $146B | Industrials | 🇺🇸 U.S. |
| 74 | Tata Consultancy | $146B | Technology | 🇮🇳 India |
| 75 | CATL | $145B | Consumer Discretionary | 🇨🇳 China |
| 76 | China Mobile | $145B | Telecommunications | 🇨🇳 China |
| 77 | Honeywell | $144B | Industrials | 🇺🇸 U.S. |
| 78 | Agricultural Bank of China | $141B | Financials | 🇨🇳 China |
| 79 | Netflix | $140B | Consumer Discretionary | 🇺🇸 U.S. |
| 80 | Meituan | $140B | Technology | 🇨🇳 China |
| 81 | ConocoPhillips | $139B | Energy | 🇺🇸 U.S. |
| 82 | AT&T | $138B | Financials | 🇺🇸 U.S. |
| 83 | CVS Health | $136B | Health Care | 🇺🇸 U.S. |
| 84 | Dior | $136B | Consumer Discretionary | 🇫🇷 France |
| 85 | Qualcomm | $136B | Technology | 🇺🇸 U.S. |
| 86 | Prosus | $135B | Technology | 🇳🇱 Netherlands |
| 87 | RBC | $135B | Financials | 🇨🇦 Canada |
| 88 | IBM | $134B | Technology | 🇺🇸 U.S. |
| 89 | Salesforce | $133B | Technology | 🇺🇸 U.S. |
| 90 | Union Pacific | $133B | Industrials | 🇺🇸 U.S. |
| 91 | Deere & Company | $132B | Industrials | 🇺🇸 U.S. |
| 92 | Unilever | $130B | Consumer Staples | 🇬🇧 United Kingdom |
| 93 | CM Bank | $130B | Financials | 🇨🇳 China |
| 94 | HDFC Bank | $129B | Financials | 🇮🇳 India |
| 95 | Elevance Health | $128B | Health Care | 🇺🇸 U.S. |
| 96 | AIA | $128B | Financials | 🇭🇰 Hong Kong |
| 97 | Lockheed Martin | $127B | Industrials | 🇺🇸 U.S. |
| 98 | PetroChina | $127B | Energy | 🇨🇳 China |
| 99 | SAP | $127B | Technology | 🇩🇪 Germany |
| 100 | Lowe's | $124B | Consumer Discretionary | 🇺🇸 U.S. |
*As of Dec 12, 2022.
Oil giant Saudi Aramco is the third largest publicly-traded company globally, at $1.8 trillion. It’s also the only non-U.S. company in the top 10.
In May, the state-run company briefly became the most valuable company on the planet as soaring energy prices boosted earnings. Saudia Arabia is the largest exporter of oil in the world, and the country’s economy is forecast to grow 7.6% in 2022—one of the fastest globally.
Overall, 62 companies of the 100 largest are headquartered in the U.S., 11 are based in China, and five are located in France.
Top 10 Performance in 2022
For many of the world’s largest companies, 2022 was a brutal year for performance.
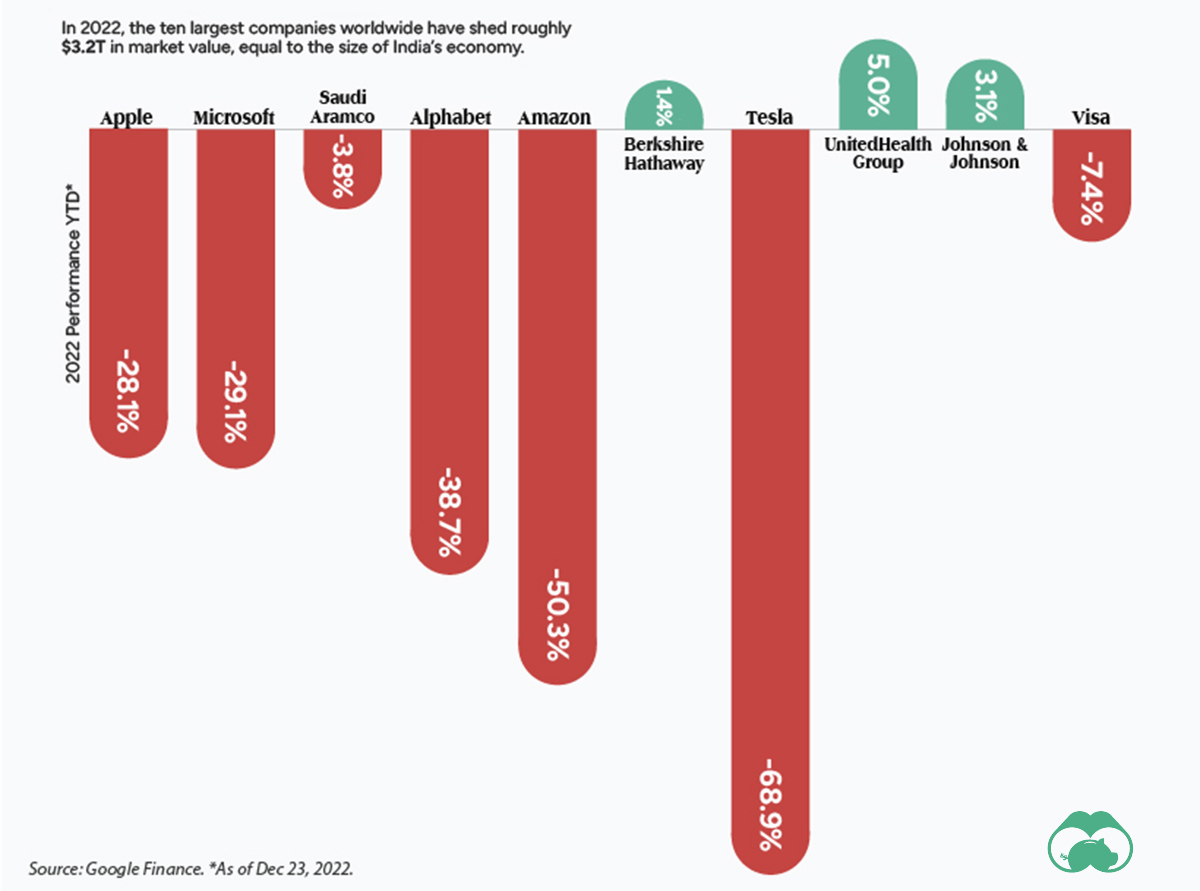
As the above graphic shows, the vast majority of the world’s titans saw their market values decline. Half of these companies saw double-digit drops.
Tesla has witnessed nearly 70% of its market cap being erased this year. Two main factors are behind this drop: falling demand, especially in China, and CEO Elon Musk’s volatile and risky acquisition of Twitter.
On the other hand, UnitedHealth Group has seen the strongest performance among the top 10.
The company, which rakes in a large share of its earnings from employer-backed insurance plans, said that recessionary impacts had not yet begun materializing in 2022.
Biggest Companies in the World, by Sector
Even with sinking market values across the sector in 2022, tech remains dominant.
Among the world’s biggest companies, 20 are in tech, spanning a combined market value of $9.2 trillion. For perspective, that’s about 31% of the market value of the 100 largest companies.
| Rank | Sector | Combined Market Value | Number of Companies | Biggest Company in Sector |
|---|---|---|---|---|
| 1 | 👩💻 Technology | $9.2T | 20 | Apple |
| 2 | 🚗 Consumer Discretionary | $4.7T | 17 | Amazon |
| 3 | 🩺 Health Care | $4.3T | 17 | UnitedHealth Group |
| 4 | 🛢️ Energy | $3.4T | 8 | Saudi Aramco |
| 5 | 💵 Financials | $3.0T | 14 | Berkshire Hathaway |
| 6 | 🏭 Industrials | $1.8T | 9 | Visa |
| 7 | 🥫 Consumer Staples | $1.8T | 7 | Procter & Gamble |
| 8 | 📞 Telecommunications | $841B | 5 | Cisco |
| 9 | ⛏️ Basic Materials | $326B | 2 | Linde |
| 10 | 🔌 Utilities | $127B | 1 | Nextera Energy |
Companies are classified according to the FTSE Russell Industry Classification Benchmark. *As of Dec 12, 2022.
Consumer discretionary and health care sectors fall next in line, with big players such as Amazon and Johnson & Johnson among their ranks.
At the other end of the spectrum is utilities, the smallest sector overall at least pertaining to the largest companies list. NextEra Energy, the sole utilities company among the rankings is one of the world’s largest developers of wind and solar energy. Over the next three years, it plans to invest up to $95 billion in greening its power operations.
Change of Fortune
It comes as no surprise that many of the biggest companies in the world are long-established players in global markets.
Yet within the rankings, some of the notable risers compared to 2021 are UnitedHealth Group, which launched from #19 in 2021 to #8 this year and NVIDIA which has climbed to become the 11th largest company globally, up from #24 last year.
By contrast, some of the biggest losers are Meta (Facebook’s parent company) and Alibaba. Meta has fallen across the rankings to #26 in 2022 from #6 in 2021. Meanwhile, Alibaba was once the ninth largest globally but has tumbled to #36. Both companies have seen considerable value wiped from their market caps—roughly 66% and 28%, respectively—amid lagging earnings.
With the year coming to a close, it remains to be seen whether the world’s biggest companies stage a comeback in 2023, or face more challenging conditions ahead.


Stocks
The 50 Best One-Year Returns on the S&P 500 (1980-2022)
The highest one-year return among the top S&P 500 stocks from 1980 to 2022 was a staggering 2,620%. Which stocks top the ranks?

The Top S&P 500 Stocks by Annual Returns
The average annual return of the S&P 500 was 10% from 1980-2022, excluding dividends. Of course, there are some companies that deliver much higher returns in any given year.
In this graphic using data from S&P Dow Jones Indices, we explore the top S&P 500 stocks with the best single year returns over the last four decades.
Ranking the Top S&P 500 Stocks
In order to find the top gainers, S&P took the top 10 best-performing stocks each year and then narrowed that list down to the top 50 overall. They ranked the top S&P 500 stocks by price returns, meaning that no dividends or stock distributions were included.
The best gains were clustered in a few select years, including the 1999 dot-com boom, the 2003 stock market rally, and the 2009 recovery from the Global Financial Crisis. None of the biggest gains happened in 2021 or 2022.
| Rank | Company | Sector | Return | Year |
|---|---|---|---|---|
| 1 | Qualcomm | Information Technology | 2620% | 1999 |
| 2 | Tesla | Consumer Discretionary | 743% | 2020 |
| 3 | DSC Communications | Communication Services | 468% | 1992 |
| 4 | Coleco Industries | Consumer Discretionary | 435% | 1982 |
| 5 | Avaya | Information Technology | 428% | 2003 |
| 6 | Chrysler | Consumer Discretionary | 426% | 1982 |
| 7 | XL Capital (Axa XL) | Financials | 395% | 2009 |
| 8 | Tenet Healthcare | Healthcare | 369% | 2009 |
| 9 | Dynegy | Utilities | 361% | 2000 |
| 10 | Advanced Micro Devices | Information Technology | 348% | 2009 |
| 11 | Sprint | Communication Services | 343% | 1999 |
| 12 | Ford | Consumer Discretionary | 337% | 2009 |
| 13 | NEXTEL Communications | Communication Services | 336% | 1999 |
| 14 | LSI Logic | Information Technology | 319% | 1999 |
| 15 | NVIDIA | Information Technology | 308% | 2001 |
| 16 | Nortel Networks | Communication Services | 304% | 1999 |
| 17 | Etsy | Consumer Discretionary | 302% | 2020 |
| 18 | Genworth Financial | Financials | 301% | 2009 |
| 19 | Micron Technology | Information Technology | 300% | 2009 |
| 20 | NetFlix | Communication Services | 298% | 2013 |
| 21 | Oracle | Information Technology | 290% | 1999 |
| 22 | Western Digital | Information Technology | 286% | 2009 |
| 23 | Network Appliance (NetApp) | Information Technology | 270% | 1999 |
| 24 | Data General | Information Technology | 267% | 1991 |
| 25 | Yahoo | Communication Services | 265% | 1999 |
| 26 | Williams Companies | Energy | 264% | 2003 |
| 27 | Novell | Information Technology | 264% | 1991 |
| 28 | Dynegy | Utilities | 263% | 2003 |
| 29 | Sun Microsystems | Information Technology | 262% | 1999 |
| 30 | PMC-Sierra | Information Technology | 262% | 2003 |
| 31 | Advanced Micro Devices | Information Technology | 259% | 1991 |
| 32 | Dell | Information Technology | 248% | 1998 |
| 33 | Global Marine | Energy | 247% | 1980 |
| 34 | Micron Technology | Information Technology | 243% | 2013 |
| 35 | Best Buy | Consumer Discretionary | 237% | 2013 |
| 36 | Reebok | Consumer Discretionary | 234% | 2000 |
| 37 | Freeport-McMoRan | Materials | 229% | 2009 |
| 38 | Biomet (Zimmer Biomet) | Healthcare | 226% | 1991 |
| 39 | NVIDIA | Information Technology | 224% | 2016 |
| 40 | Gap | Consumer Discretionary | 223% | 1991 |
| 41 | NetFlix | Communication Services | 219% | 2010 |
| 42 | Fleetwood Enterprises (Fleetwood RV) | Consumer Discretionary | 217% | 1982 |
| 43 | National Semiconductor | Information Technology | 217% | 1999 |
| 44 | Dell | Information Technology | 216% | 1997 |
| 45 | Tandy Corp (RadioShack) | Information Technology | 216% | 1980 |
| 46 | Novell | Information Technology | 215% | 2003 |
| 47 | Corning | Information Technology | 215% | 2003 |
| 48 | CB Richard Ellis (CBRE) | Real Estate | 214% | 2009 |
| 49 | AES Corp | Utilities | 213% | 2003 |
| 50 | Expedia | Consumer Discretionary | 212% | 2009 |
Qualcomm was by far the top-performer in any one calendar year window. The company had key patents for Code Division Multiple Access (CDMA) technology, which enabled fast wireless internet access and became the basis for 3G networks.
Its stock took off in 1999 as it shed less profitable business lines, resolved a patent dispute with competitor Ericsson, and joined the S&P 500 Index. At the time, CNN reported that one lucky investor who heard about Qualcomm from an investment-banker-turned-rabbi earned $17 million—roughly $30 million in today’s dollars.
The most recent stocks to make the rankings were both from 2020: well-known Tesla (#2) and lesser-known online marketplace Etsy (#17), which saw sales from independent creators surge during the early COVID-19 pandemic. The dollar value of items sold on Etsy more than doubled from $5.3 billion in 2019 to $10.3 billion in 2020, with mask sales accounting for 7% of the total.
Biggest Gainers in Each Sector
While information technology stocks made up nearly half of the list, there is representation from nine of the 11 S&P 500 sectors. No companies from the Industrials or Consumer Staples sectors made it into the ranks of the top S&P 500 stocks by annual returns.
Below, we show the stock with the best annual return for each sector.

Tesla was the top-performing Consumer Discretionary stock on the list. After meeting the requirement of four consecutive quarters of positive earnings, it joined the S&P 500 Index on December 21, 2020. The company’s performance was boosted by the announcement that it would be included in the S&P 500, along with strong performance in China, and general EV buzz as environmental regulations tightened worldwide.
In the realm of Communication Services, DSC Communications saw a sizable return in 1992. The telecommunications equipment company had contracts with major companies such as Bell and Motorola. Alcatel-Lucent (then Alcatel), a French producer of mobile phones, purchased DSC Communications in 1998.
Serial Success Stories
It’s impressive to make the list of the top S&P 500 stocks by calendar returns once, but there are seven companies that have done it twice.
Some stocks saw their repeated outperformance close together, with Dell making the ranks back-to-back in 1997 and 1998.

On the other hand, a select few have more staying power. Computing giant NVIDIA topped the charts in 2001 and triumphed again 15 years later in 2016. And this year might be another win, as the company has recently reached a $1 trillion market capitalization and has the highest year-to-date return in the S&P 500 as of July 6, 2023.

-

 Politics14 hours ago
How Do Chinese Citizens Feel About Other Countries?
-

 Markets4 weeks ago
Visualizing Every Company on the S&P 500 Index
-

 Markets2 weeks ago
Visualizing 1 Billion Square Feet of Empty Office Space
-

 Energy4 weeks ago
Life Cycle Emissions: EVs vs. Combustion Engine Vehicles
-

 Maps2 weeks ago
Vintage Viz: The World’s Rivers and Lakes, Organized Neatly
-

 Markets3 weeks ago
Visualized: The 100 Largest U.S. Banks by Consolidated Assets
-

 Automation1 week ago
Charted: Changing Sentiments Towards AI in the Workplace
-

 Markets3 weeks ago
What are Top Investment Managers Holding in Their Portfolios?