Markets
10-Year Annualized Forecasts for Major Asset Classes
10-Year Annualized Forecasts for Major Asset Classes
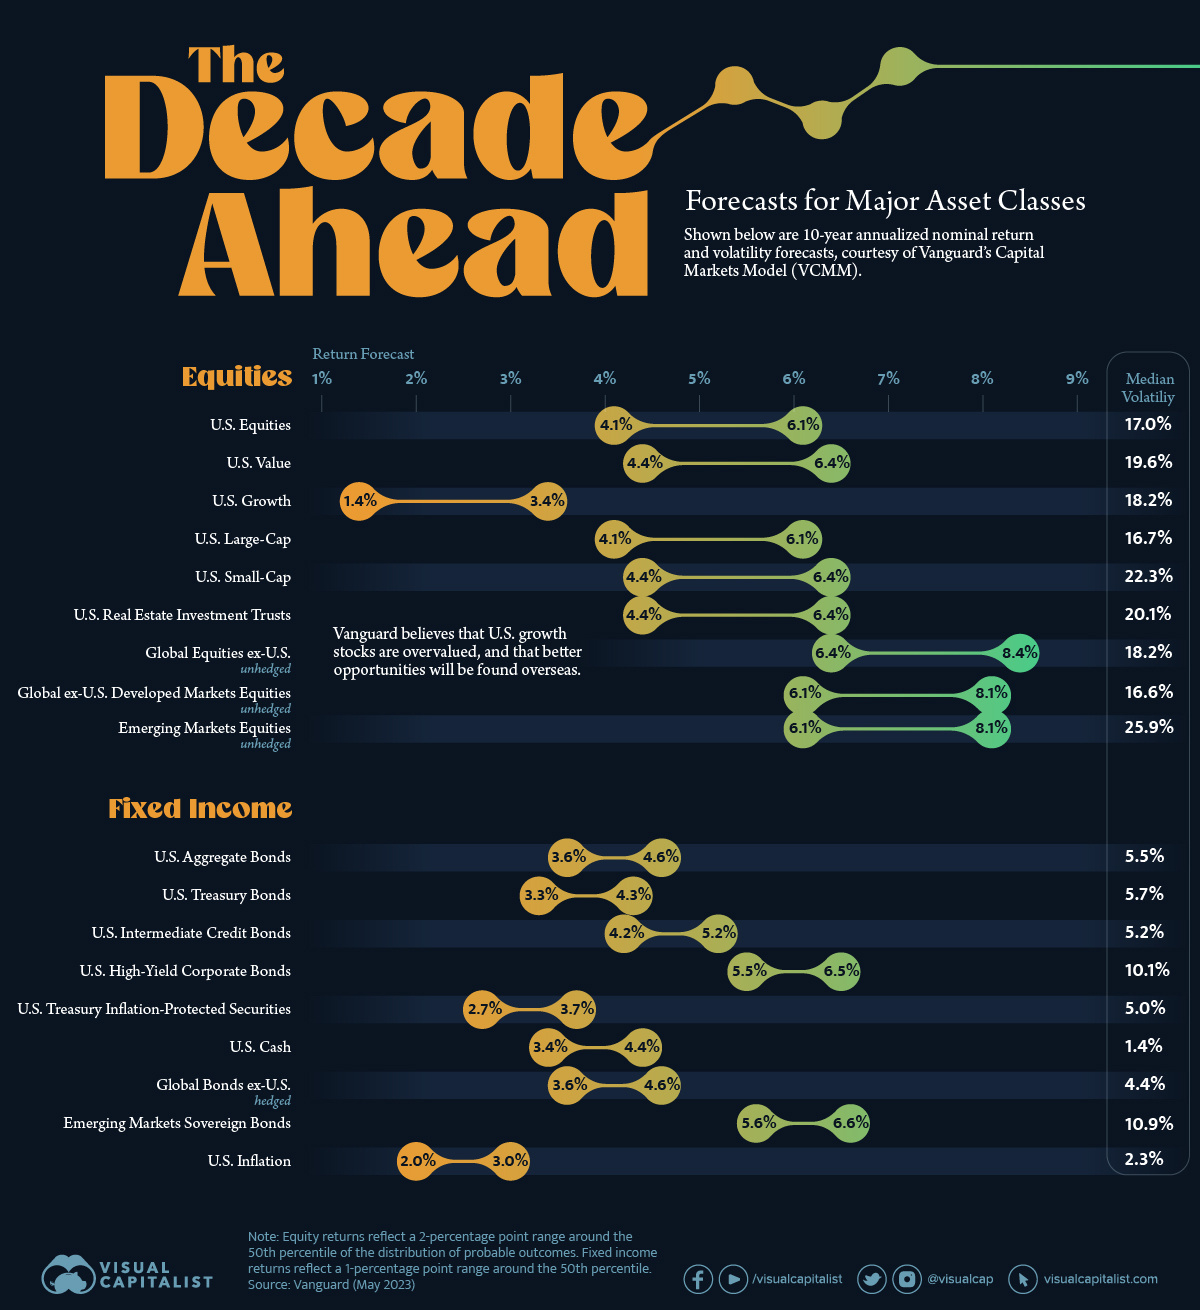
While there’s no way of predicting the future, quantitative models can help us come up with a general idea of how different asset classes may perform in the future.
One example is Vanguard’s Capital Markets Model (VCMM), which has produced a set of 10-year annualized return forecasts for both equity and fixed income markets.
Visualized above, these projections were published on May 17, 2023, and are based on the March 31, 2023 running of the VCMM.
Equity Returns
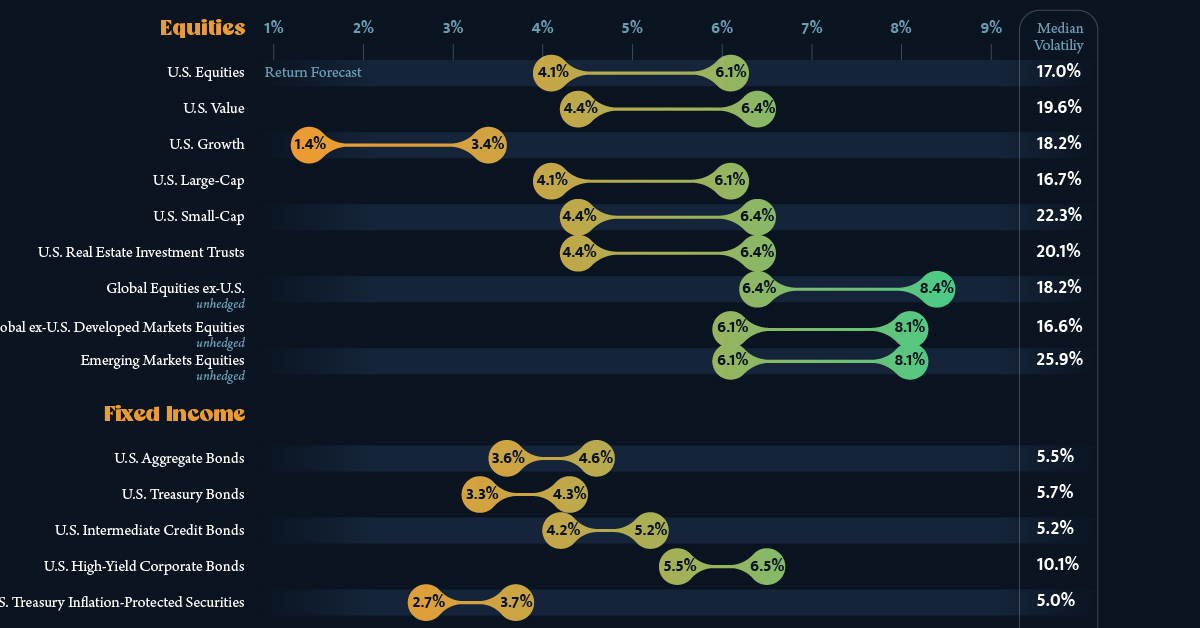
The equity forecasts from this infographic are listed in the following table.
| Asset Class | Return Forecast (lower) | Return Forecast (upper) | Median Volatility |
|---|---|---|---|
| U.S. Equities | 4.1% | 6.1% | 17.0% |
| U.S. Value | 4.4% | 6.4% | 19.6% |
| U.S. Growth | 1.4% | 3.4% | 18.2% |
| U.S. Large-Cap | 4.1% | 6.1% | 16.7% |
| U.S. Small-Cap | 4.4% | 6.4% | 22.3% |
| U.S. Real Estate Investment Trusts | 4.4% | 6.4% | 20.1% |
| Global Equities ex-U.S. (unhedged) | 6.4% | 8.4% | 18.2% |
| Global ex-U.S. Developed Markets Equities (unhedged) | 6.1% | 8.1% | 16.6% |
| Emerging Markets Equities (unhedged) | 6.1% | 8.1% | 25.9% |
A key takeaway here is that Vanguard expects international equities to outperform U.S. equities over the next decade.
We believe that the valuation-based expansion in U.S. equities is sowing the seeds for lower returns in the decade.
A valuation-based expansion refers to the increase in a company’s market value, rather than its intrinsic value. In other words, Vanguard doesn’t believe that current U.S. equity valuations are justified, and that this will dampen performance over the next decade.
Cited reasons for international outperformance include more favorable valuations, higher dividend payout ratios, and a potentially weaker U.S. dollar.
Fixed Income Returns
Now turning to fixed income, here are the forecasts used in this infographic.
| Asset Class | Return Forecast (lower) | Return Forecast (upper) | Median Volatility |
|---|---|---|---|
| U.S. Aggregate Bonds | 3.6% | 4.6% | 5.5% |
| U.S. Treasury Bonds | 3.3% | 4.3% | 5.7% |
| U.S. Intermediate Credit Bonds | 4.2% | 5.2% | 5.2% |
| U.S. High-Yield Corporate Bonds | 5.5% | 6.5% | 10.1% |
| U.S. Treasury Inflation-Protected Securities | 2.7% | 3.7% | 5.0% |
| U.S. Cash | 3.4% | 4.4% | 1.4% |
| Global Bonds ex-U.S. (hedged) | 3.6% | 4.6% | 4.4% |
| Emerging Markets Sovereign Bonds | 5.6% | 6.6% | 10.9% |
| U.S. Inflation | 2.0% | 3.0% | 2.3% |
Several bond indexes saw record-breaking declines in 2022 thanks to the unprecedented speed of interest rate hikes. Despite this turmoil, Vanguard believes that investors with a longer horizon will actually be better off as a result. The reasoning here is that cash flows can now be reinvested at much higher rates, which over time should offset any declines in an investor’s bond portfolio.
Vanguard also expects U.S. inflation to be contained over the next decade. The firm has confidence in the ability of central banks to keep inflation at their target rates (2% in most developed economies).


Stocks
The 50 Best One-Year Returns on the S&P 500 (1980-2022)
The highest one-year return among the top S&P 500 stocks from 1980 to 2022 was a staggering 2,620%. Which stocks top the ranks?

The Top S&P 500 Stocks by Annual Returns
The average annual return of the S&P 500 was 10% from 1980-2022, excluding dividends. Of course, there are some companies that deliver much higher returns in any given year.
In this graphic using data from S&P Dow Jones Indices, we explore the top S&P 500 stocks with the best single year returns over the last four decades.
Ranking the Top S&P 500 Stocks
In order to find the top gainers, S&P took the top 10 best-performing stocks each year and then narrowed that list down to the top 50 overall. They ranked the top S&P 500 stocks by price returns, meaning that no dividends or stock distributions were included.
The best gains were clustered in a few select years, including the 1999 dot-com boom, the 2003 stock market rally, and the 2009 recovery from the Global Financial Crisis. None of the biggest gains happened in 2021 or 2022.
| Rank | Company | Sector | Return | Year |
|---|---|---|---|---|
| 1 | Qualcomm | Information Technology | 2620% | 1999 |
| 2 | Tesla | Consumer Discretionary | 743% | 2020 |
| 3 | DSC Communications | Communication Services | 468% | 1992 |
| 4 | Coleco Industries | Consumer Discretionary | 435% | 1982 |
| 5 | Avaya | Information Technology | 428% | 2003 |
| 6 | Chrysler | Consumer Discretionary | 426% | 1982 |
| 7 | XL Capital (Axa XL) | Financials | 395% | 2009 |
| 8 | Tenet Healthcare | Healthcare | 369% | 2009 |
| 9 | Dynegy | Utilities | 361% | 2000 |
| 10 | Advanced Micro Devices | Information Technology | 348% | 2009 |
| 11 | Sprint | Communication Services | 343% | 1999 |
| 12 | Ford | Consumer Discretionary | 337% | 2009 |
| 13 | NEXTEL Communications | Communication Services | 336% | 1999 |
| 14 | LSI Logic | Information Technology | 319% | 1999 |
| 15 | NVIDIA | Information Technology | 308% | 2001 |
| 16 | Nortel Networks | Communication Services | 304% | 1999 |
| 17 | Etsy | Consumer Discretionary | 302% | 2020 |
| 18 | Genworth Financial | Financials | 301% | 2009 |
| 19 | Micron Technology | Information Technology | 300% | 2009 |
| 20 | NetFlix | Communication Services | 298% | 2013 |
| 21 | Oracle | Information Technology | 290% | 1999 |
| 22 | Western Digital | Information Technology | 286% | 2009 |
| 23 | Network Appliance (NetApp) | Information Technology | 270% | 1999 |
| 24 | Data General | Information Technology | 267% | 1991 |
| 25 | Yahoo | Communication Services | 265% | 1999 |
| 26 | Williams Companies | Energy | 264% | 2003 |
| 27 | Novell | Information Technology | 264% | 1991 |
| 28 | Dynegy | Utilities | 263% | 2003 |
| 29 | Sun Microsystems | Information Technology | 262% | 1999 |
| 30 | PMC-Sierra | Information Technology | 262% | 2003 |
| 31 | Advanced Micro Devices | Information Technology | 259% | 1991 |
| 32 | Dell | Information Technology | 248% | 1998 |
| 33 | Global Marine | Energy | 247% | 1980 |
| 34 | Micron Technology | Information Technology | 243% | 2013 |
| 35 | Best Buy | Consumer Discretionary | 237% | 2013 |
| 36 | Reebok | Consumer Discretionary | 234% | 2000 |
| 37 | Freeport-McMoRan | Materials | 229% | 2009 |
| 38 | Biomet (Zimmer Biomet) | Healthcare | 226% | 1991 |
| 39 | NVIDIA | Information Technology | 224% | 2016 |
| 40 | Gap | Consumer Discretionary | 223% | 1991 |
| 41 | NetFlix | Communication Services | 219% | 2010 |
| 42 | Fleetwood Enterprises (Fleetwood RV) | Consumer Discretionary | 217% | 1982 |
| 43 | National Semiconductor | Information Technology | 217% | 1999 |
| 44 | Dell | Information Technology | 216% | 1997 |
| 45 | Tandy Corp (RadioShack) | Information Technology | 216% | 1980 |
| 46 | Novell | Information Technology | 215% | 2003 |
| 47 | Corning | Information Technology | 215% | 2003 |
| 48 | CB Richard Ellis (CBRE) | Real Estate | 214% | 2009 |
| 49 | AES Corp | Utilities | 213% | 2003 |
| 50 | Expedia | Consumer Discretionary | 212% | 2009 |
Qualcomm was by far the top-performer in any one calendar year window. The company had key patents for Code Division Multiple Access (CDMA) technology, which enabled fast wireless internet access and became the basis for 3G networks.
Its stock took off in 1999 as it shed less profitable business lines, resolved a patent dispute with competitor Ericsson, and joined the S&P 500 Index. At the time, CNN reported that one lucky investor who heard about Qualcomm from an investment-banker-turned-rabbi earned $17 million—roughly $30 million in today’s dollars.
The most recent stocks to make the rankings were both from 2020: well-known Tesla (#2) and lesser-known online marketplace Etsy (#17), which saw sales from independent creators surge during the early COVID-19 pandemic. The dollar value of items sold on Etsy more than doubled from $5.3 billion in 2019 to $10.3 billion in 2020, with mask sales accounting for 7% of the total.
Biggest Gainers in Each Sector
While information technology stocks made up nearly half of the list, there is representation from nine of the 11 S&P 500 sectors. No companies from the Industrials or Consumer Staples sectors made it into the ranks of the top S&P 500 stocks by annual returns.
Below, we show the stock with the best annual return for each sector.

Tesla was the top-performing Consumer Discretionary stock on the list. After meeting the requirement of four consecutive quarters of positive earnings, it joined the S&P 500 Index on December 21, 2020. The company’s performance was boosted by the announcement that it would be included in the S&P 500, along with strong performance in China, and general EV buzz as environmental regulations tightened worldwide.
In the realm of Communication Services, DSC Communications saw a sizable return in 1992. The telecommunications equipment company had contracts with major companies such as Bell and Motorola. Alcatel-Lucent (then Alcatel), a French producer of mobile phones, purchased DSC Communications in 1998.
Serial Success Stories
It’s impressive to make the list of the top S&P 500 stocks by calendar returns once, but there are seven companies that have done it twice.
Some stocks saw their repeated outperformance close together, with Dell making the ranks back-to-back in 1997 and 1998.

On the other hand, a select few have more staying power. Computing giant NVIDIA topped the charts in 2001 and triumphed again 15 years later in 2016. And this year might be another win, as the company has recently reached a $1 trillion market capitalization and has the highest year-to-date return in the S&P 500 as of July 6, 2023.
-

 Energy4 weeks ago
Life Cycle Emissions: EVs vs. Combustion Engine Vehicles
-

 Maps2 weeks ago
Vintage Viz: The World’s Rivers and Lakes, Organized Neatly
-

 United States3 weeks ago
Visualized: The 100 Largest U.S. Banks by Consolidated Assets
-

 AI1 week ago
Charted: Changing Sentiments Towards AI in the Workplace
-

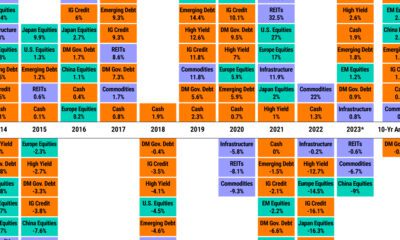
 Markets3 weeks ago
What are Top Investment Managers Holding in Their Portfolios?
-

 Stocks1 week ago
The 50 Best One-Year Returns on the S&P 500 (1980-2022)
-

 United States3 weeks ago
Chart: U.S. Home Price Growth Over 50 Years
-

 Cities1 week ago
Mapped: The Most Dangerous Cities in the U.S.