Ranking the Trade Policies of the G20


Ranking the Trade Policies of the G20
In October 2021, the leaders of the G20 nations met for their annual summit in Rome. On the agenda were important items such as climate change, corporate taxation, and of course, the issue of global trade.
Altogether, the G20 represents 85% of global GDP and 66% of the world’s population. It is therefore important to track their trade policy regimes, as they have a significant impact on growth and development.
With this in mind, The Hinrich Foundation has analyzed the policy interventions of every G20 member following the Rome summit to see how global protectionism has advanced.
Liberalizing vs. Harmful Interventions
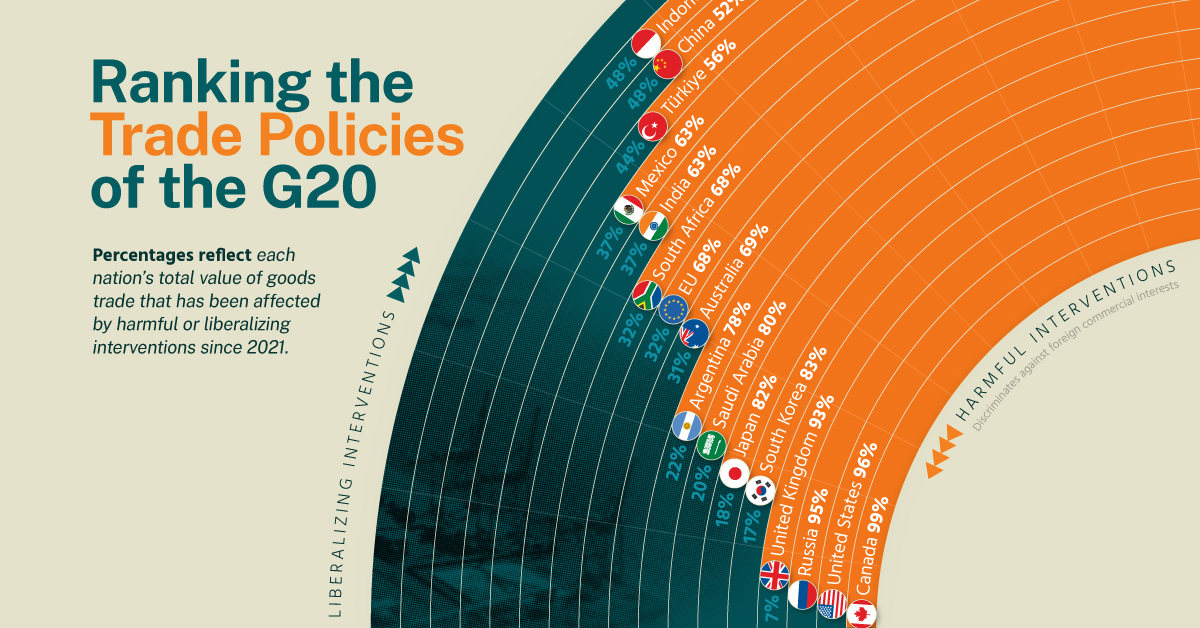
The first chart in this infographic measures the percentage of each nation’s total value of goods trade that has been affected by harmful or liberalizing interventions.
We define liberalizing interventions as those that liberalize on a non-discriminatory or most favored nation basis. On the other hand, harmful interventions are those that discriminate against the commercial interests of a foreign country.
From this data we can see that Brazil is the only G20 member to have liberalized more trade than it discriminated against.
Note that our data only includes 17 economies. This is because the G20 includes France, Germany, and Italy, while our dataset aggregates them under EU.
| G20 Member | % Liberalizing | % Harmful |
|---|---|---|
| 🇧🇷 Brazil | 76% | 24% |
| 🇮🇩 Indonesia | 48% | 52% |
| 🇨🇳 China | 48% | 52% |
| 🇹🇷 Türkiye | 44% | 56% |
| 🇲🇽 Mexico | 37% | 63% |
| 🇮🇳 India | 37% | 63% |
| 🇿🇦 South Africa | 32% | 68% |
| 🇪🇺 EU | 32% | 68% |
| 🇦🇺 Australia | 31% | 69% |
| 🇦🇷 Argentina | 22% | 78% |
| 🇸🇦 Saudi Arabia | 20% | 80% |
| 🇯🇵 Japan | 18% | 82% |
| 🇰🇷 South Korea | 17% | 83% |
| 🇬🇧 UK | 7% | 93% |
| 🇷🇺 Russia | 5% | 95% |
| 🇺🇸 US | 4% | 96% |
| 🇨🇦 Canada | 1% | 99% |
Based on the trade policies enacted between the Rome Summit (Oct 2021) and the Bali Summit (Nov 2022). Source: Global Trade Alert (2022)
Across the rest of the G20, the majority of goods trade was subject to harmful trade policies. This could include import tariffs, state subsidies for domestic industries, and even outright bans.
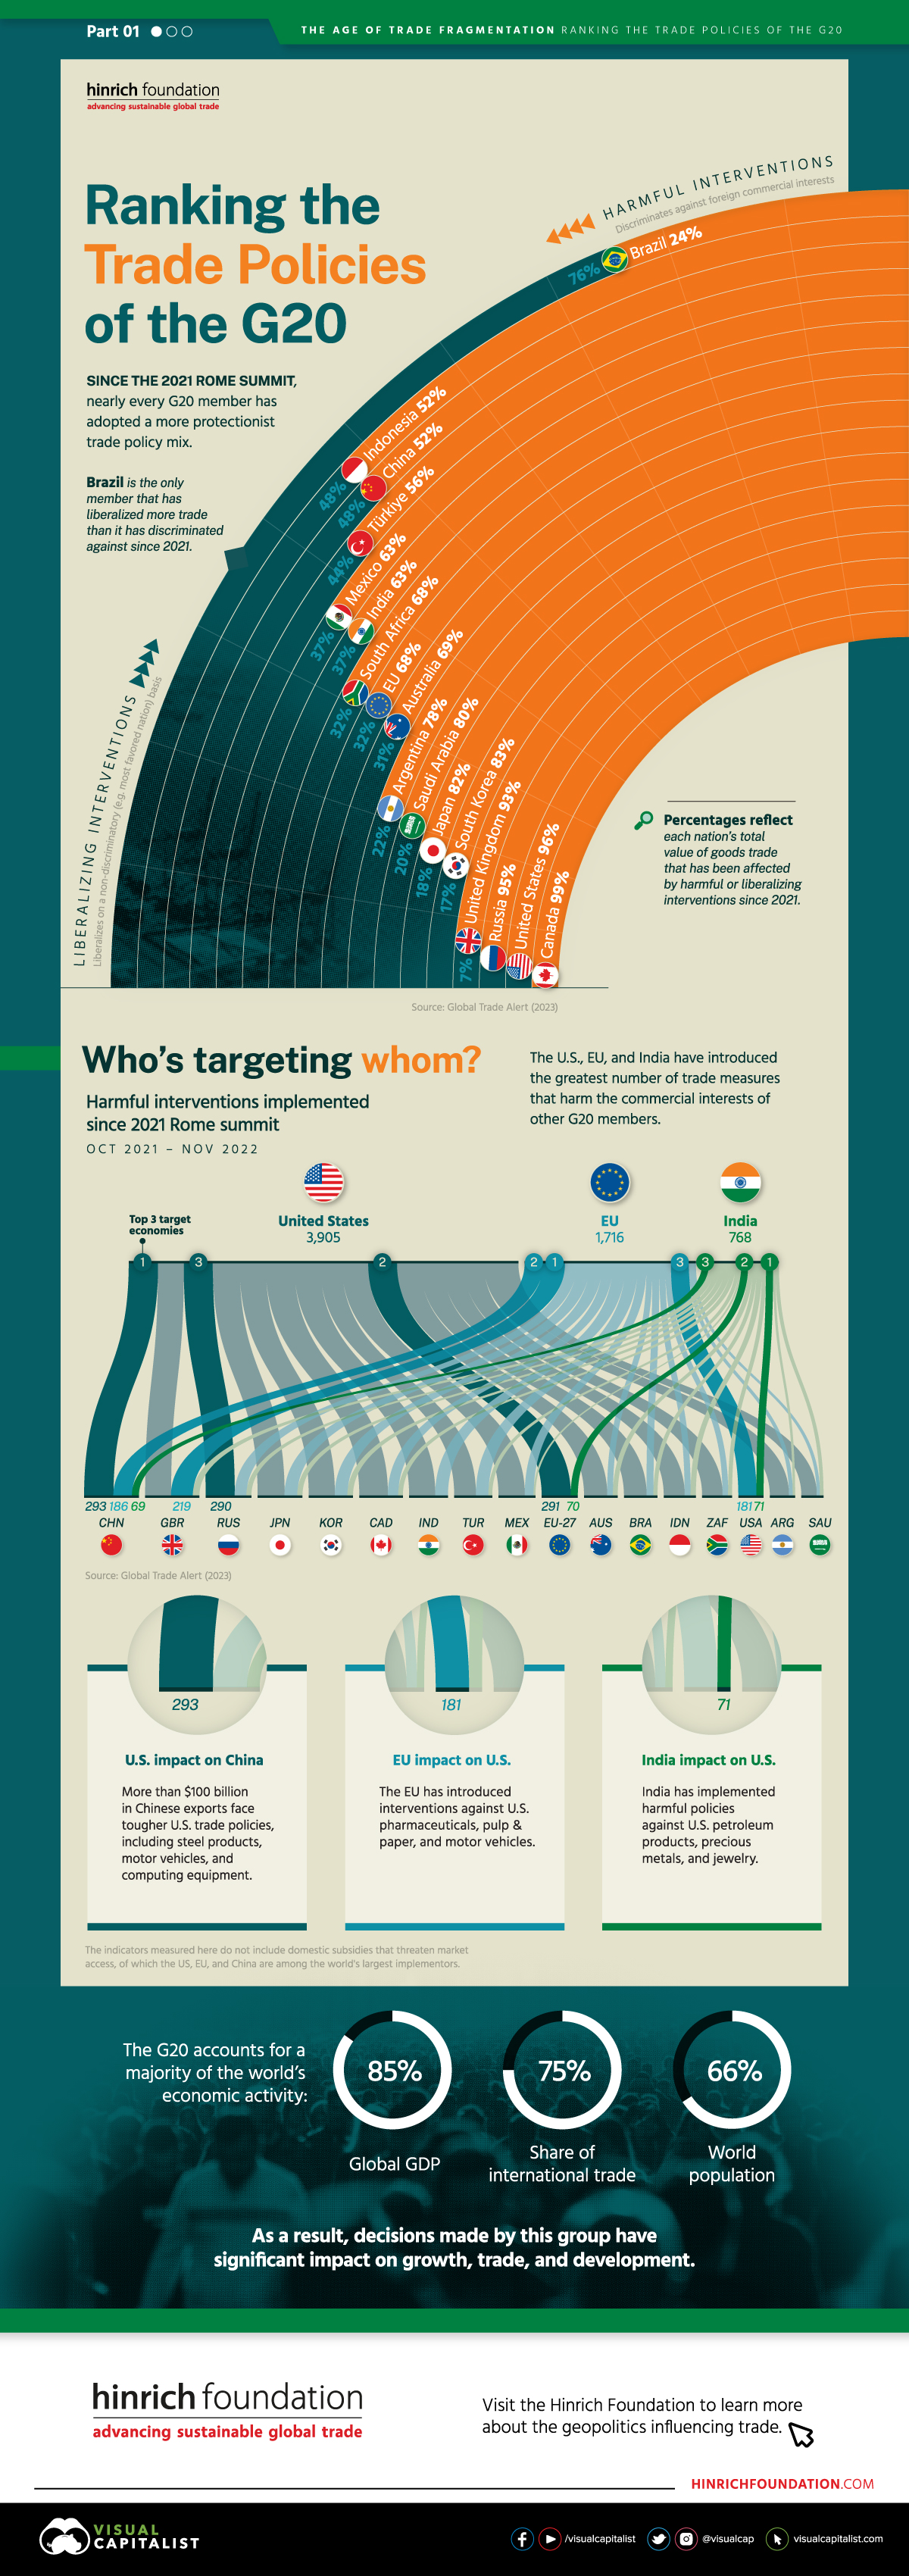
Who’s Targeting Whom?
Turning focus to the number of harmful trade measures introduced, we can identify the U.S., EU, and India as the top three implementers. The full list is included below.
| Country | Number of harmful interventions |
|---|---|
| 🇺🇸 United States of America | 3,905 |
| 🇪🇺 EU | 1,716 |
| 🇮🇳 India | 768 |
| 🇧🇷 Brazil | 697 |
| 🇷🇺 Russia | 644 |
| 🇦🇺 Australia | 304 |
| 🇦🇷 Argentina | 264 |
| 🇹🇷 Türkiye | 223 |
| 🇮🇩 Indonesia | 217 |
| 🇯🇵 Japan | 171 |
| 🇨🇦 Canada | 141 |
| 🇬🇧 United Kingdom | 137 |
| 🇸🇦 Saudi Arabia | 101 |
| 🇰🇷 South Korea | 79 |
| 🇿🇦 South Africa | 60 |
| 🇲🇽 Mexico | 54 |
| 🇨🇳 China | 38 |
The top three target economies of the U.S. were China (293 measures), the EU (291), and Russia (290). Over $100 billion in Chinese exports such as steel products, motor vehicles, and computing equipment are subject to harmful interventions.
The EU’s top three targets were the UK (219), China (186), and the U.S. (181).
This graphic is the first in a three-part series by The Hinrich Foundation that covers the geopolitics of trade.

-

 Politics17 hours ago
How Do Chinese Citizens Feel About Other Countries?
What is the Chinese public’s view of world powers? This visual breaks down Chinese sentiment towards other countries.
-

 Cities7 days ago
Mapped: The Safest Cities in the U.S.
How safe is small town America? This map reveals the safest cities in the U.S. in terms of the total crime rate per every 1,000 residents.
-

 Maps1 week ago
Mapped: The Most Dangerous Cities in the U.S.
This map shows the most dangerous cities in the U.S. in terms of the violent crime rate per 1,000 residents.
-

 Automation1 week ago
Charted: Changing Sentiments Towards AI in the Workplace
Opinions about using AI in the workplace have undergone a transformation from 2018, and so have the AI tools themselves.
-

 Markets2 weeks ago
Visualizing 1 Billion Square Feet of Empty Office Space
Empty office space is hitting record highs in 2023. We show almost 1 billion square feet of unused space stacked as a single office tower.
-

 Markets3 weeks ago
Chart: U.S. Home Price Growth Over 50 Years
Home price growth has moderated amid rising interest rates and a narrow housing supply. Here’s how prices compare to historical trends.