Economy
Interactive: Comparing Military Spend Around the World
Article/Editing:
Comparing Military Spend Around the World
One of the easiest ways to identify a nation’s priorities is by tracking its expenditures, and military spend is no different.
Usually spending is measured, and ranked, in absolute amounts. For example, countries around the world collectively spent $2.1 trillion on their militaries in 2021, with the most coming from the U.S. ($800 billion), China ($293 billion), and India ($77 billion).
But these eye-popping figures are best understood in the context of each country’s economy. Using data from the Stockholm International Peace Research Institute (SIPRI), Varun Jain has visualized 158 countries’ military expenditures, both as a percentage of their total GDP as well as in average per-capita spend.
Countries’ Military Spend as a Percentage of their Economy
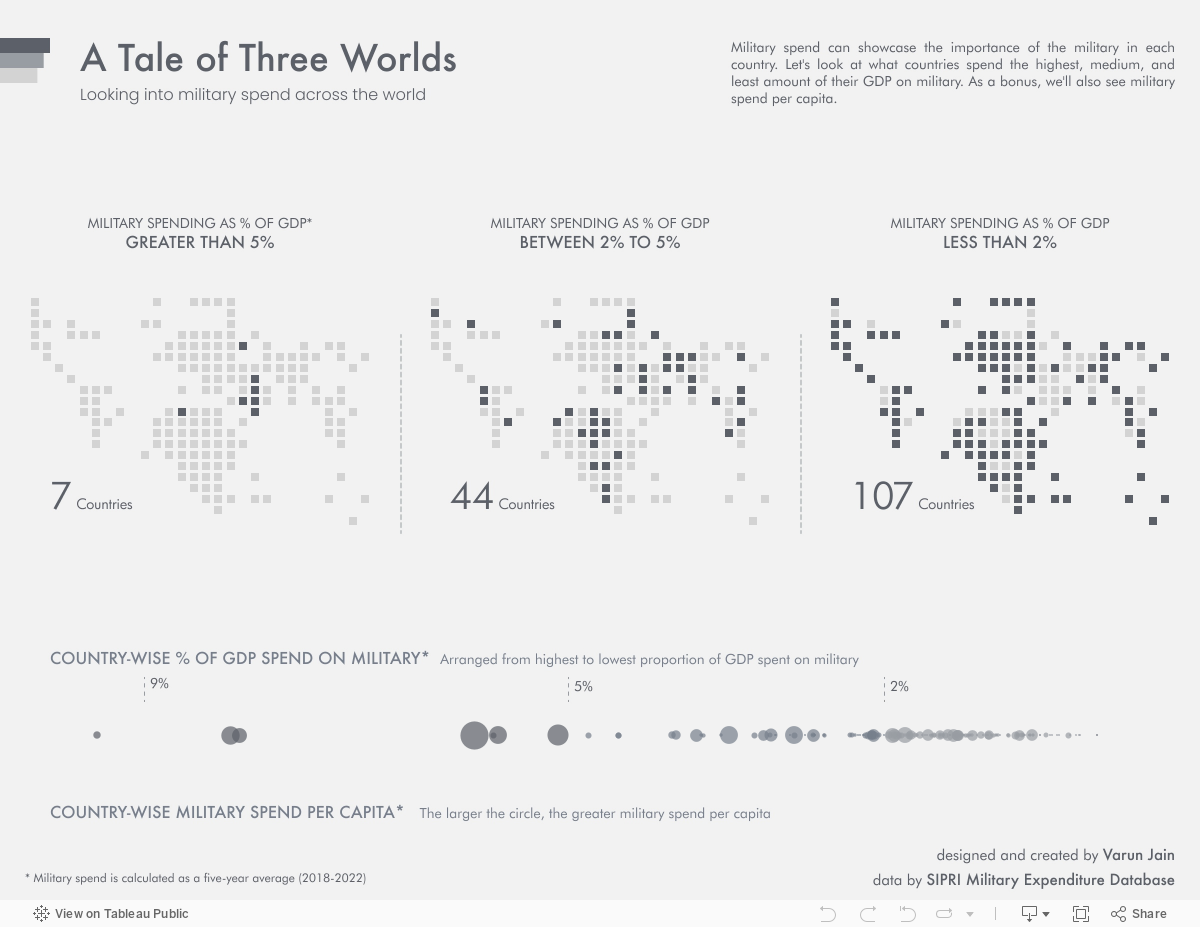
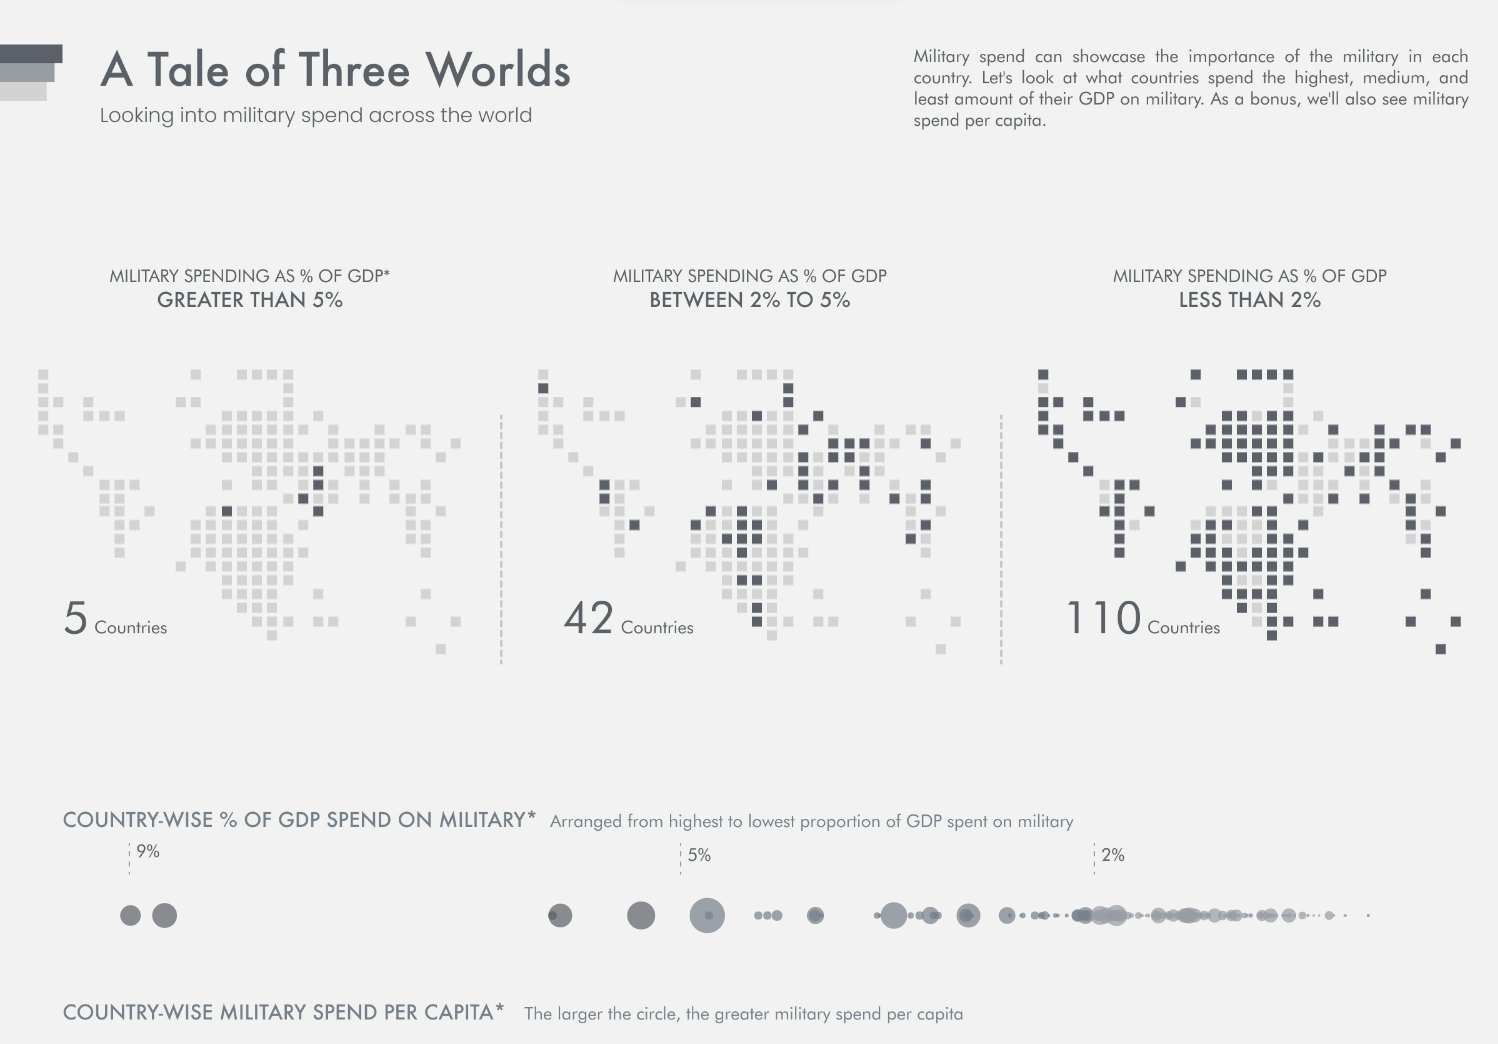
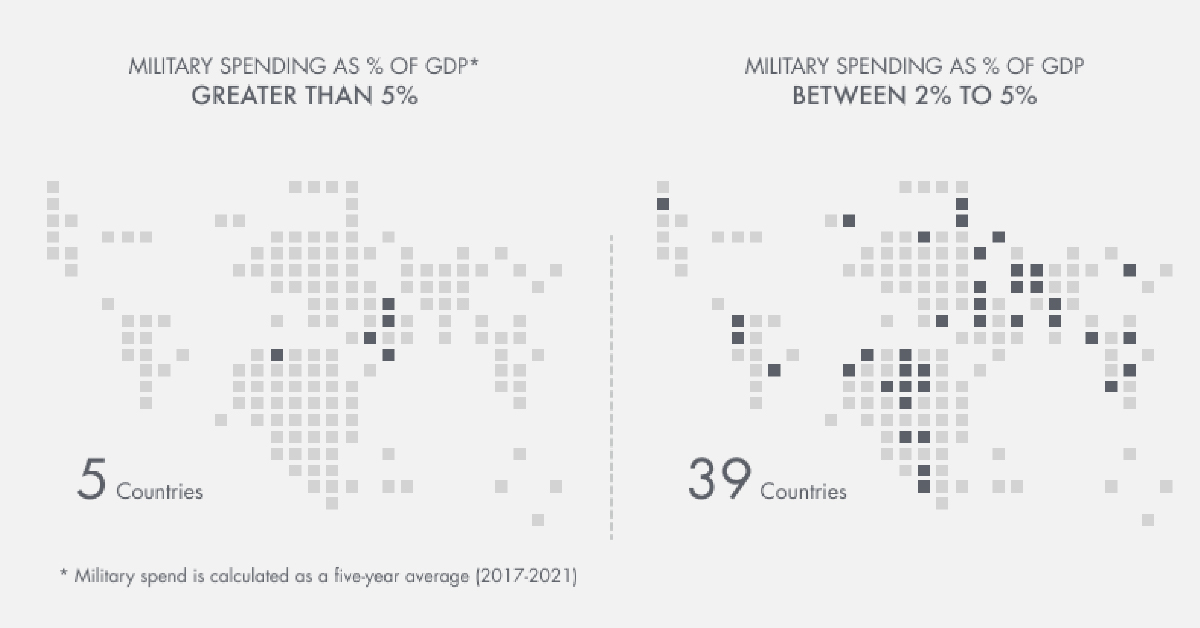
To begin, Jain identified three categories of military expenditure as a percent of GDP, using the five-year (2018‒2022) average for more consistent data:
| Military Spend | % of GDP | Countries |
|---|---|---|
| High | Above 5% | 7 |
| Medium | 2‒5% | 44 |
| Low | Below 2% | 107 |
Under this categorization, the stand outs are the countries spending an outsized amount of their economic output on military, rather than the highest total spenders in absolute terms.
At the top of the table is Ukraine, which has earmarked a staggering average of 9.46% of its total economic output on defense over the past five years. That’s well ahead of second-place Saudi Arabia, which is slightly above 8%.
In Ukraine’s case, its high ranking shows how quickly priorities can change. From 2018 to 2021, the country spent 3.2-3.8% of its GDP on its military, but the outbreak of war with Russia saw its expenditures jump to one-third of economic output.
Other countries from the Middle East and North Africa follow in this tier, with Oman third at 8.11% and Qatar fourth with 5.88%. Rounding out the top seven high spenders are Algeria, Kuwait, and Israel.
| Rank | Country | Military Spend | % of GDP |
|---|---|---|---|
| 1 | 🇺🇦 Ukraine | High | 9.46% |
| 2 | 🇸🇦 Saudi Arabia | High | 8.19% |
| 3 | 🇴🇲 Oman | High | 8.11% |
| 4 | 🇶🇦 Qatar | High | 5.88% |
| 5 | 🇩🇿 Algeria | High | 5.70% |
| 6 | 🇰🇼 Kuwait | High | 5.66% |
| 7 | 🇮🇱 Israel | High | 5.09% |
| 8 | 🇯🇴 Jordan | Medium | 4.81% |
| 9 | 🇦🇲 Armenia | Medium | 4.53% |
| 10 | 🇦🇿 Azerbaijan | Medium | 4.53% |
| 11 | 🇱🇧 Lebanon | Medium | 4.01% |
| 12 | 🇷🇺 Russia | Medium | 3.98% |
| 13 | 🇧🇭 Bahrain | Medium | 3.79% |
| 14 | 🇵🇰 Pakistan | Medium | 3.75% |
| 15 | 🇲🇦 Morocco | Medium | 3.72% |
| 16 | 🇺🇿 Uzbekistan | Medium | 3.56% |
| 17 | 🇺🇸 U.S. | Medium | 3.48% |
| 18 | 🇨🇴 Colombia | Medium | 3.24% |
| 19 | 🇬🇷 Greece | Medium | 3.15% |
| 20 | 🇳🇦 Namibia | Medium | 3.09% |
| 21 | 🇧🇳 Brunei | Medium | 3.09% |
| 22 | 🇸🇸 South Sudan | Medium | 3.05% |
| 23 | 🇹🇬 Togo | Medium | 3.03% |
| 24 | 🇲🇱 Mali | Medium | 2.90% |
| 25 | 🇨🇺 Cuba | Medium | 2.88% |
| 26 | 🇸🇬 Singapore | Medium | 2.86% |
| 27 | 🇧🇼 Botswana | Medium | 2.86% |
| 28 | 🇲🇲 Myanmar | Medium | 2.76% |
| 29 | 🇧🇫 Burkina Faso | Medium | 2.70% |
| 30 | 🇮🇶 Iraq | Medium | 2.69% |
| 31 | 🇰🇷 South Korea | Medium | 2.69% |
| 32 | 🇨🇬 Republic of Congo | Medium | 2.68% |
| 33 | 🇹🇩 Chad | Medium | 2.66% |
| 34 | 🇮🇳 India | Medium | 2.58% |
| 35 | 🇹🇳 Tunisia | Medium | 2.58% |
| 36 | 🇪🇨 Ecuador | Medium | 2.34% |
| 37 | 🇮🇷 Iran | Medium | 2.32% |
| 38 | 🇻🇳 Viet Nam | Medium | 2.28% |
| 39 | 🇰🇭 Cambodia | Medium | 2.26% |
| 40 | 🇲🇷 Mauritania | Medium | 2.24% |
| 41 | 🇳🇪 Niger | Medium | 2.21% |
| 42 | 🇧🇮 Burundi | Medium | 2.21% |
| 43 | 🇹🇷 Turkey | Medium | 2.19% |
| 44 | 🇵🇱 Poland | Medium | 2.17% |
| 45 | 🇱🇻 Latvia | Medium | 2.14% |
| 46 | 🇱🇹 Lithuania | Medium | 2.13% |
| 47 | 🇪🇪 Estonia | Medium | 2.13% |
| 48 | 🇬🇧 United Kingdom | Medium | 2.12% |
| 49 | 🇺🇾 Uruguay | Medium | 2.11% |
| 50 | 🇷🇸 Serbia | Medium | 2.06% |
| 51 | 🇺🇬 Uganda | Medium | 2.02% |
| 52 | 🇭🇷 Croatia | Low | 1.97% |
| 53 | 🇦🇺 Australia | Low | 1.93% |
| 54 | 🇨🇱 Chile | Low | 1.92% |
| 55 | 🇫🇷 France | Low | 1.91% |
| 56 | 🇨🇾 Cyprus | Low | 1.90% |
| 57 | 🇷🇴 Romania | Low | 1.87% |
| 58 | 🇧🇬 Bulgaria | Low | 1.85% |
| 59 | 🇸🇿 Eswatini | Low | 1.82% |
| 60 | 🇳🇴 Norway | Low | 1.81% |
| 61 | 🇨🇫 Central African Republic | Low | 1.78% |
| 62 | 🇱🇰 Sri Lanka | Low | 1.77% |
| 63 | 🇵🇹 Portugal | Low | 1.77% |
| 64 | 🇹🇼 Taiwan | Low | 1.76% |
| 65 | 🇨🇳 China | Low | 1.72% |
| 66 | 🇬🇪 Georgia | Low | 1.71% |
| 67 | 🇸🇰 Slovakia | Low | 1.67% |
| 68 | 🇬🇼 Guinea-Bissau | Low | 1.65% |
| 69 | 🇰🇬 Kyrgyzstan | Low | 1.62% |
| 70 | 🇬🇳 Guinea | Low | 1.61% |
| 71 | 🇫🇮 Finland | Low | 1.60% |
| 72 | 🇸🇳 Senegal | Low | 1.58% |
| 73 | 🇭🇳 Honduras | Low | 1.56% |
| 74 | 🇬🇦 Gabon | Low | 1.56% |
| 75 | 🇲🇿 Mozambique | Low | 1.56% |
| 76 | 🇱🇸 Lesotho | Low | 1.56% |
| 77 | 🇲🇪 Montenegro | Low | 1.54% |
| 78 | 🇫🇯 Fiji | Low | 1.54% |
| 79 | 🇯🇲 Jamaica | Low | 1.49% |
| 80 | 🇦🇴 Angola | Low | 1.48% |
| 81 | 🇮🇹 Italy | Low | 1.48% |
| 82 | 🇭🇺 Hungary | Low | 1.48% |
| 83 | 🇧🇴 Bolivia | Low | 1.46% |
| 84 | 🇸🇨 Seychelles | Low | 1.43% |
| 85 | 🇳🇱 Netherlands | Low | 1.41% |
| 86 | 🇸🇩 Sudan | Low | 1.39% |
| 87 | 🇷🇼 Rwanda | Low | 1.39% |
| 88 | 🇳🇵 Nepal | Low | 1.36% |
| 89 | 🇩🇰 Denmark | Low | 1.36% |
| 90 | 🇦🇱 Albania | Low | 1.34% |
| 91 | 🇪🇸 Spain | Low | 1.34% |
| 92 | 🇹🇭 Thailand | Low | 1.33% |
| 93 | 🇦🇫 Afghanistan | Low | 1.33% |
| 94 | 🇳🇿 New Zealand | Low | 1.32% |
| 95 | 🇨🇦 Canada | Low | 1.32% |
| 96 | 🇩🇪 Germany | Low | 1.31% |
| 97 | 🇲🇰 North Macedonia | Low | 1.30% |
| 98 | 🇧🇷 Brazil | Low | 1.29% |
| 99 | 🇧🇿 Belize | Low | 1.28% |
| 100 | 🇸🇻 El Salvador | Low | 1.28% |
| 101 | 🇧🇩 Bangladesh | Low | 1.26% |
| 102 | 🇿🇲 Zambia | Low | 1.25% |
| 103 | 🇬🇶 Equatorial Guinea | Low | 1.24% |
| 104 | 🇬🇾 Guyana | Low | 1.22% |
| 105 | 🇨🇮 Cote d'Ivoire | Low | 1.22% |
| 106 | 🇪🇬 Egypt | Low | 1.20% |
| 107 | 🇵🇪 Peru | Low | 1.20% |
| 108 | 🇧🇾 Belarus | Low | 1.18% |
| 109 | 🇸🇪 Sweden | Low | 1.17% |
| 110 | 🇰🇪 Kenya | Low | 1.13% |
| 111 | 🇸🇮 Slovenia | Low | 1.10% |
| 112 | 🇹🇱 Timor Leste | Low | 1.08% |
| 113 | 🇹🇿 Tanzania | Low | 1.05% |
| 114 | 🇨🇲 Cameroon | Low | 1.04% |
| 115 | 🇹🇯 Tajikistan | Low | 1.03% |
| 116 | 🇯🇵 Japan | Low | 1.03% |
| 117 | 🇧🇪 Belgium | Low | 1.02% |
| 118 | 🇱🇷 Liberia | Low | 1.00% |
| 119 | 🇲🇾 Malaysia | Low | 0.98% |
| 120 | 🇵🇭 Philippines | Low | 0.96% |
| 121 | 🇵🇾 Paraguay | Low | 0.95% |
| 122 | 🇽🇰 Kosovo | Low | 0.95% |
| 123 | 🇿🇦 South Africa | Low | 0.94% |
| 124 | 🇲🇼 Malawi | Low | 0.92% |
| 125 | 🇧🇦 Bosnia and Herzegovina | Low | 0.84% |
| 126 | 🇰🇿 Kazakhstan | Low | 0.83% |
| 127 | 🇦🇹 Austria | Low | 0.78% |
| 128 | 🇬🇲 Gambia | Low | 0.76% |
| 129 | 🇹🇹 Trinidad & Tobago | Low | 0.75% |
| 130 | 🇮🇩 Indonesia | Low | 0.74% |
| 131 | 🇨🇭 Switzerland | Low | 0.73% |
| 132 | 🇨🇿 Czech Republic | Low | 0.71% |
| 133 | 🇩🇴 Dominican Republic | Low | 0.70% |
| 134 | 🇲🇳 Mongolia | Low | 0.69% |
| 135 | 🇲🇬 Madagascar | Low | 0.68% |
| 136 | 🇨🇩 Dem. Rep. of Congo | Low | 0.64% |
| 137 | 🇳🇬 Nigeria | Low | 0.64% |
| 138 | 🇪🇹 Ethiopia | Low | 0.64% |
| 139 | 🇸🇱 Sierra Leone | Low | 0.64% |
| 140 | 🇦🇷 Argentina | Low | 0.63% |
| 141 | 🇱🇺 Luxembourg | Low | 0.61% |
| 142 | 🇲🇽 Mexico | Low | 0.61% |
| 143 | 🇳🇮 Nicaragua | Low | 0.60% |
| 144 | 🇨🇻 Cape Verde | Low | 0.54% |
| 145 | 🇧🇯 Benin | Low | 0.54% |
| 146 | 🇲🇹 Malta | Low | 0.48% |
| 147 | 🇬🇹 Guatemala | Low | 0.45% |
| 148 | 🇬🇭 Ghana | Low | 0.43% |
| 149 | 🇵🇬 Papua New Guinea | Low | 0.38% |
| 150 | 🇲🇩 Moldova | Low | 0.36% |
| 151 | 🇮🇪 Ireland | Low | 0.27% |
| 152 | 🇿🇼 Zimbabwe | Low | 0.26% |
| 153 | 🇻🇪 Venezuela | Low | 0.20% |
| 154 | 🇭🇹 Haiti | Low | 0.17% |
| 155 | 🇲🇺 Mauritius | Low | 0.16% |
| 156 | 🇨🇷 Costa Rica | Low | 0.00% |
| 157 | 🇮🇸 Iceland | Low | 0.00% |
| 158 | 🇵🇦 Panama | Low | 0.00% |
The medium group consists of 44 countries and is led by four nations (Jordan, Armenia, Azerbaijan, and Lebanon) that all spend more than 4% of their GDP on their militaries. Other familiar countries known to have large military budgets, like Russia, Pakistan, the U.S., India and the UK, are also in this category.
The low spend group has a total of 107 countries, but also contains some surprises. For example, China, France, and Germany—all in the top 10 countries by absolute military spend—actually have similar amounts of military spend as a percent of GDP as Georgia, Cyprus, and North Macedonia respectively.
At the bottom of the table are countries with either low military importance, or strange technicalities. For example, Mauritius is one of the countries with the lowest military budgets because it doesn’t officially have a standing military, instead relying on two paramilitary forces (a special mobile force and a Coast Guard).
Similarly, Iceland allocates 0% of its GDP towards military spending. In place of a standing army, the country maintains a specialized peacekeeping force, a substantial Coast Guard, and relies on security alliances within NATO, of which it is a member and provides financial support to.
Ranking Defense Spending Per Capita
While the measure above equalizes military spend on economic strength, per-capita military spending shows how much countries allocate while accounting for population size.
On a per-capita basis (again using a five-year average), Qatar leads the ranks with a per-capita spend of $4,564, well-ahead of Israel at $2,535, and Saudi Arabia at $1,928.
| Rank | Country | Per Capita Spend ($) |
|---|---|---|
| 1 | 🇶🇦 Qatar | $4,564 |
| 2 | 🇮🇱 Israel | $2,535 |
| 3 | 🇸🇦 Saudi Arabia | $1,928 |
| 4 | 🇸🇬 Singapore | $1,837 |
| 5 | 🇰🇼 Kuwait | $1,815 |
| 6 | 🇺🇸 U.S. | $1,815 |
| 7 | 🇳🇴 Norway | $1,438 |
| 8 | 🇴🇲 Oman | $1,254 |
| 9 | 🇦🇺 Australia | $1,131 |
| 10 | 🇧🇳 Brunei | $959 |
| 11 | 🇬🇧 UK | $913 |
| 12 | 🇰🇷 South Korea | $894 |
| 13 | 🇧🇭 Bahrain | $863 |
| 14 | 🇩🇰 Denmark | $861 |
| 15 | 🇫🇷 France | $811 |
| 16 | 🇫🇮 Finland | $801 |
| 17 | 🇳🇱 Netherlands | $765 |
| 18 | 🇱🇺 Luxembourg | $694 |
| 19 | 🇸🇪 Sweden | $662 |
| 20 | 🇨🇭 Switzerland | $647 |
| 21 | 🇨🇦 Canada | $645 |
| 22 | 🇬🇷 Greece | $629 |
| 23 | 🇩🇪 Germany | $623 |
| 24 | 🇳🇿 New Zealand | $610 |
| 25 | 🇪🇪 Estonia | $535 |
| 26 | 🇹🇼 Taiwan | $495 |
| 27 | 🇮🇹 Italy | $494 |
| 28 | 🇧🇪 Belgium | $487 |
| 29 | 🇷🇺 Russia | $467 |
| 30 | 🇱🇹 Lithuania | $463 |
| 31 | 🇵🇹 Portugal | $417 |
| 32 | 🇱🇻 Latvia | $405 |
| 33 | 🇨🇾 Cyprus | $399 |
| 34 | 🇯🇵 Japan | $398 |
| 35 | 🇪🇸 Spain | $395 |
| 36 | 🇦🇹 Austria | $393 |
| 37 | 🇵🇱 Poland | $359 |
| 38 | 🇺🇾 Uruguay | $354 |
| 39 | 🇸🇰 Slovakia | $334 |
| 40 | 🇱🇧 Lebanon | $334 |
| 41 | 🇸🇮 Slovenia | $302 |
| 42 | 🇺🇦 Ukraine | $302 |
| 43 | 🇭🇷 Croatia | $294 |
| 44 | 🇨🇱 Chile | $292 |
| 45 | 🇷🇴 Romania | $258 |
| 46 | 🇭🇺 Hungary | $248 |
| 47 | 🇮🇪 Ireland | $235 |
| 48 | 🇸🇨 Seychelles | $230 |
| 49 | 🇦🇿 Azerbaijan | $226 |
| 50 | 🇩🇿 Algeria | $219 |
| 51 | 🇦🇲 Armenia | $217 |
| 52 | 🇧🇼 Botswana | $215 |
| 53 | 🇯🇴 Jordan | $207 |
| 54 | 🇹🇷 Turkey | $199 |
| 55 | 🇨🇴 Colombia | $197 |
| 56 | 🇧🇬 Bulgaria | $194 |
| 57 | 🇨🇳 China | $183 |
| 58 | 🇲🇹 Malta | $175 |
| 59 | 🇨🇿 Czech Republic | $175 |
| 60 | 🇮🇷 Iran | $169 |
| 61 | 🇳🇦 Namibia | $159 |
| 62 | 🇮🇶 Iraq | $145 |
| 63 | 🇪🇨 Ecuador | $138 |
| 64 | 🇲🇪 Montenegro | $137 |
| 65 | 🇷🇸 Serbia | $133 |
| 66 | 🇹🇹 Trinidad & Tobago | $131 |
| 67 | 🇬🇦 Gabon | $124 |
| 68 | 🇲🇦 Morocco | $122 |
| 69 | 🇬🇶 Equatorial Guinea | $112 |
| 70 | 🇲🇾 Malaysia | $109 |
| 71 | 🇧🇷 Brazil | $107 |
| 72 | 🇹🇭 Thailand | $97 |
| 73 | 🇬🇾 Guyana | $92 |
| 74 | 🇹🇳 Tunisia | $91 |
| 75 | 🇫🇯 Fiji | $83 |
| 76 | 🇲🇰 North Macedonia | $83 |
| 77 | 🇰🇿 Kazakhstan | $82 |
| 78 | 🇵🇪 Peru | $81 |
| 79 | 🇬🇪 Georgia | $80 |
| 80 | 🇧🇾 Belarus | $80 |
| 81 | 🇯🇲 Jamaica | $77 |
| 82 | 🇦🇱 Albania | $76 |
| 83 | 🇸🇿 Eswatini | $72 |
| 84 | 🇱🇰 Sri Lanka | $69 |
| 85 | 🇦🇷 Argentina | $66 |
| 86 | 🇧🇿 Belize | $60 |
| 87 | 🇲🇽 Mexico | $59 |
| 88 | 🇩🇴 Dominican Republic | $58 |
| 89 | 🇻🇳 Viet Nam | $58 |
| 90 | 🇿🇦 South Africa | $56 |
| 91 | 🇸🇻 El Salvador | $54 |
| 92 | 🇧🇦 Bosnia and Herzegovina | $54 |
| 93 | 🇮🇳 India | $53 |
| 94 | 🇨🇬 Republic of Congo | $53 |
| 95 | 🇵🇾 Paraguay | $52 |
| 96 | 🇧🇴 Bolivia | $51 |
| 97 | 🇵🇰 Pakistan | $49 |
| 98 | 🇺🇿 Uzbekistan | $44 |
| 99 | 🇦🇴 Angola | $43 |
| 100 | 🇽🇰 Kosovo | $42 |
| 101 | 🇲🇷 Mauritania | $42 |
| 102 | 🇭🇳 Honduras | $42 |
| 103 | 🇪🇬 Egypt | $41 |
| 104 | 🇰🇭 Cambodia | $36 |
| 105 | 🇲🇲 Myanmar | $35 |
| 106 | 🇵🇭 Philippines | $33 |
| 107 | 🇲🇳 Mongolia | $33 |
| 108 | 🇮🇩 Indonesia | $31 |
| 109 | 🇧🇩 Bangladesh | $27 |
| 110 | 🇹🇱 Timor Leste | $27 |
| 111 | 🇲🇱 Mali | $26 |
| 112 | 🇸🇳 Senegal | $24 |
| 113 | 🇨🇮 Cote d'Ivoire | $23 |
| 114 | 🇹🇬 Togo | $21 |
| 115 | 🇰🇪 Kenya | $21 |
| 116 | 🇰🇬 Kyrgyzstan | $20 |
| 117 | 🇧🇫 Burkina Faso | $20 |
| 118 | 🇬🇳 Guinea | $19 |
| 119 | 🇱🇸 Lesotho | $19 |
| 120 | 🇨🇻 Cape Verde | $19 |
| 121 | 🇬🇹 Guatemala | $19 |
| 122 | 🇹🇩 Chad | $18 |
| 123 | 🇸🇸 South Sudan | $18 |
| 124 | 🇸🇩 Sudan | $18 |
| 125 | 🇺🇬 Uganda | $18 |
| 126 | 🇿🇼 Zimbabwe | $17 |
| 127 | 🇿🇲 Zambia | $16 |
| 128 | 🇲🇺 Mauritius | $16 |
| 129 | 🇨🇲 Cameroon | $16 |
| 130 | 🇳🇵 Nepal | $15 |
| 131 | 🇳🇬 Nigeria | $14 |
| 132 | 🇳🇮 Nicaragua | $12 |
| 133 | 🇬🇼 Guinea-Bissau | $12 |
| 134 | 🇹🇿 Tanzania | $12 |
| 135 | 🇨🇺 Cuba | $11 |
| 136 | 🇷🇼 Rwanda | $11 |
| 137 | 🇲🇩 Moldova | $11 |
| 138 | 🇵🇬 Papua New Guinea | $10 |
| 139 | 🇳🇪 Niger | $10 |
| 140 | 🇹🇯 Tajikistan | $9 |
| 141 | 🇨🇫 Central African Republic | $8 |
| 142 | 🇲🇿 Mozambique | $8 |
| 143 | 🇬🇭 Ghana | $8 |
| 144 | 🇧🇯 Benin | $7 |
| 145 | 🇧🇮 Burundi | $7 |
| 146 | 🇦🇫 Afghanistan | $6 |
| 147 | 🇬🇲 Gambia | $6 |
| 148 | 🇪🇹 Ethiopia | $5 |
| 149 | 🇻🇪 Venezuela | $5 |
| 150 | 🇲🇼 Malawi | $4 |
| 151 | 🇸🇱 Sierra Leone | $3 |
| 152 | 🇲🇬 Madagascar | $3 |
| 153 | 🇨🇩 Dem. Rep. of Congo | $3 |
| 154 | 🇱🇷 Liberia | $3 |
| 155 | 🇭🇹 Haiti | $2 |
| 156 | 🇨🇷 Costa Rica | $0 |
| 157 | 🇮🇸 Iceland | $0 |
| 158 | 🇵🇦 Panama | $0 |
Measured this way, we get a perspective of how small defense budgets can be per person, even if the total expenditure is large.
For example, India has the fourth-highest total defense expenditure in 2022, but because of its massive population only sets aside $53 per resident for its military, putting it solidly at the bottom third of the per-capita rankings.
Patterns Revealed By Measuring Military Spend
Changing how we look at a country’s military budget can reveal a lot more than just looking at absolute numbers.
For example, the Middle East is the region with the highest spenders on defense as a percentage of their GDP, giving us insight into regional security concerns.
Countries from the medium group of military spending—including parts of Eastern Europe, sub-Saharan Africa, and South Asia—highlight past or recent conflict zones between neighbors, countries with internal strife, or countries wary of a regional aggressor. Ukraine’s average per capita military spend, for example, was just $122.4 from 2018 to 2021. The next year, it jumped nearly 10 times to $1,018.66 per person after Russia’s invasion.
In fact, European military spending saw its sharpest one-year jump in 30 years as a direct result of the war.
Alongside European anxieties, ongoing tension between China and Taiwan has also contributed to increased military spending in Asia and Oceania. Will these budgets continue their dramatic ascent or will they rise evenly alongside their relative economies in 2023?
Data note: For these comparisons, the creator is calculating five-year averages (using data from 2018-2022) for military spending as a percentage of GDP and per-capita military spending for each country. The military expenditure data is pulled from Stockholm International Peace Research Institute.
Data for some countries is missing or may vary significantly from official figures. Countries with up to
two years of missing data had averages calculated on the years available, while countries with three or more years of missing data have been removed from this dataset, including: Djibouti, Eritrea, North Korea, Laos, Libya, Somalia, Syria, Turkmenistan, UAE, and Yemen.
Please see SIPRI’s methodologies page for more details on how they collect their data and create estimates.

This article was published as a part of Visual Capitalist's Creator Program, which features data-driven visuals from some of our favorite Creators around the world.


China
How Do Chinese Citizens Feel About Other Countries?
What is the Chinese public’s view of world powers? This visual breaks down Chinese sentiment towards other countries.
Public Opinion: How Chinese Citizens Feel About Other Countries
Tensions over Taiwan, the COVID-19 pandemic, trade, and the war in Ukraine have impacted Chinese sentiment towards other countries.
This visualization uses data from the Center for International Security and Strategy (CISS) at Tsinghua University to rank survey responses from the Chinese public on their attitudes towards countries and regions around the world.
Chinese Sentiment Towards Other Countries in 2023
In the Center’s opinion polls, which surveyed a random sample of more than 2,500 Chinese mainland adults in November 2022, Russia came out significantly ahead.
Just under 60% of respondents held Russia in a favorable view, with 19% seeing the country as “very favorable.” Contrast that to the mere 12% that viewed the U.S. in a positive light.
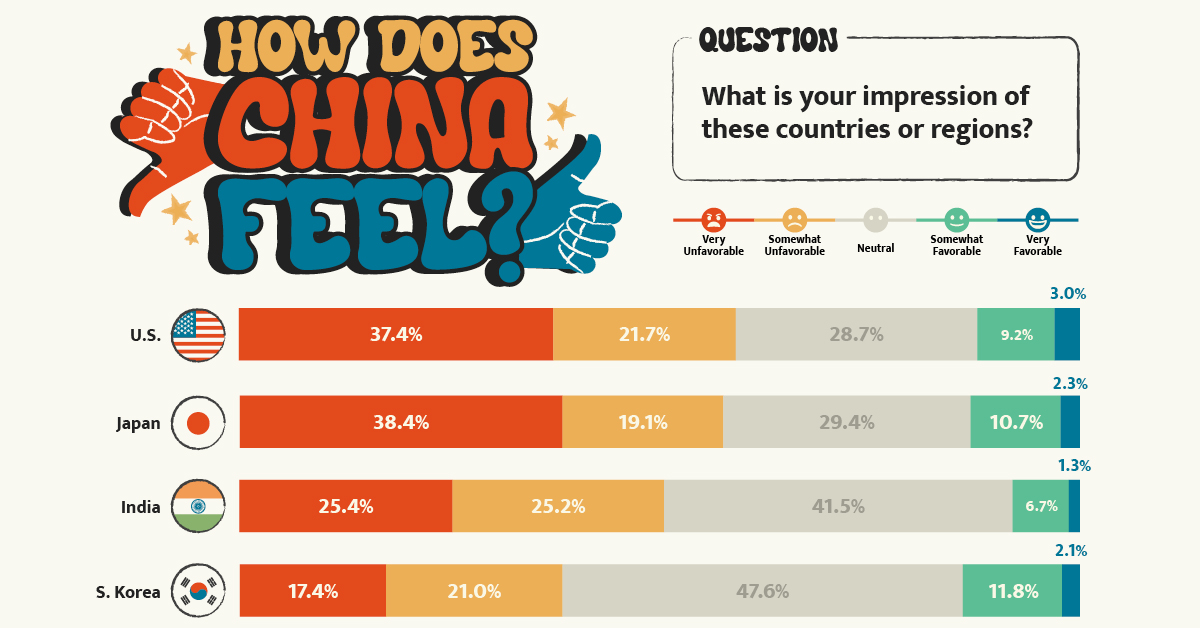
Here’s a closer look at the data. The percentages refer to the share of respondents that voted for said category.
| Country/Region | Very Unfavorable | Somewhat Unfavorable | Neutral | Somewhat Favorable | Very Favorable |
|---|---|---|---|---|---|
| 🇺🇸 United States | 37.4% | 21.7% | 28.7% | 9.2% | 3.0% |
| 🇯🇵 Japan | 38.4% | 19.1% | 29.4% | 10.7% | 2.3% |
| 🇮🇳 India | 25.4% | 25.2% | 41.5% | 6.7% | 1.3% |
| 🇰🇷 South Korea | 17.4% | 21.0% | 47.6% | 11.8% | 2.1% |
| 🇪🇺 European Union | 9.3% | 15.6% | 57.6% | 14.1% | 3.3% |
| Southeast Asia | 7.1% | 13.1% | 59.5% | 16.8% | 3.5% |
| 🇷🇺 Russia | 3.0% | 4.8% | 33.7% | 39.4% | 19.0% |
Japan ranked just below the U.S. in terms of overall unfavorability, though a slightly higher share of respondents saw Japan as “very unfavorable” compared to America. This is likely due to both modern tensions in the East China Sea over mutually claimed islands and historical tensions over the Sino-Japanese Wars.
Chinese sentiment towards India was also unfavorable at just over 50%, though notably the country also received the lowest favorability rating at just 8%.
Additional Survey Findings
The survey also found that 39% of Chinese people get their information on international security from Chinese state-run media (mainly through TV), with an additional 19% getting information from government websites and official social accounts. Conversely, only 1.7% get their news from foreign websites and foreign social media, partially due to the Great Firewall.
When asked about different international security issues, the biggest shares of Chinese citizens ranked the following as their top three:
- Pandemics (12.9%)
- Disputes over territory and territorial waters (12.9%)
- China-U.S. relations (12.0%)
The pandemic’s high score reflects the harsher impact COVID-19 had on China. Chinese borders were shut for years and the public faced intense measures to reduce spread.
In terms of other world events, the majority of Chinese people align with a more “Eastern” viewpoint. For example, in regards to the war in Ukraine, the report found that:
“About 80 percent of the respondents believe the U.S. and Western countries should be held most accountable [for the war], while less than ten percent of the respondents argue that Russia is mainly responsible.”– Center for International Security and Strategy, Tsinghua University
Overall, the views of the Chinese public reflect the opposite of those found in many Western countries. They provide an important insight that it is not just the Chinese government holding particular views about the world, but the Chinese public as well.

-

 Environment5 days ago
Hotter Than Ever: 2023 Sets New Global Temperature Records
-

 Datastream4 weeks ago
Can You Calculate Your Daily Carbon Footprint?
-

 Energy2 weeks ago
Who’s Still Buying Russian Fossil Fuels in 2023?
-

 VC+4 days ago
What’s New on VC+ in July
-

 Investor Education4 weeks ago
Visualizing BlackRock’s Top Equity Holdings
-

 apps2 weeks ago
Meet the Competing Apps Battling for Twitter’s Market Share
-

 China14 hours ago
How Do Chinese Citizens Feel About Other Countries?
-

 Markets4 weeks ago
Visualizing Every Company on the S&P 500 Index