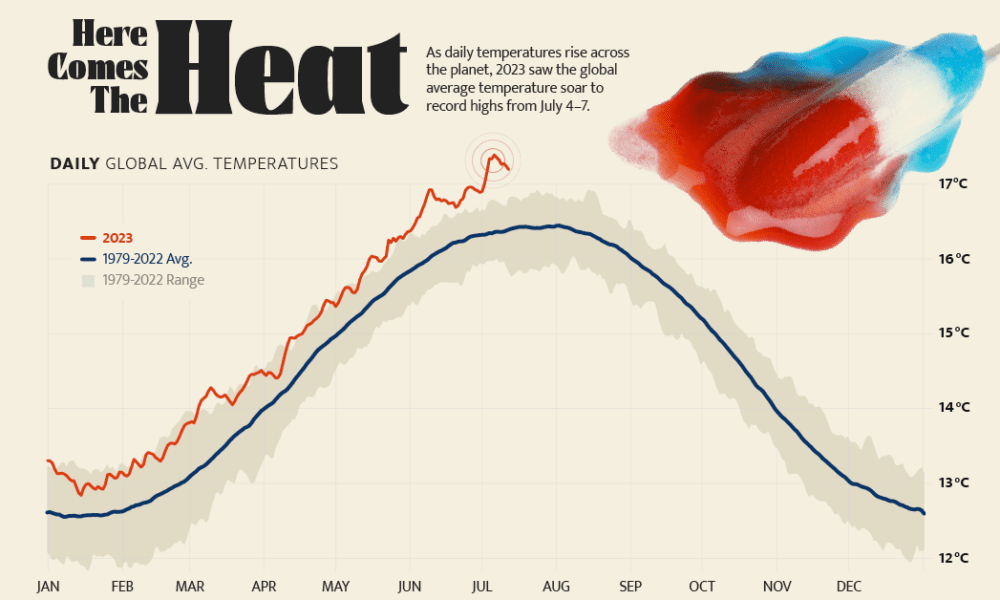
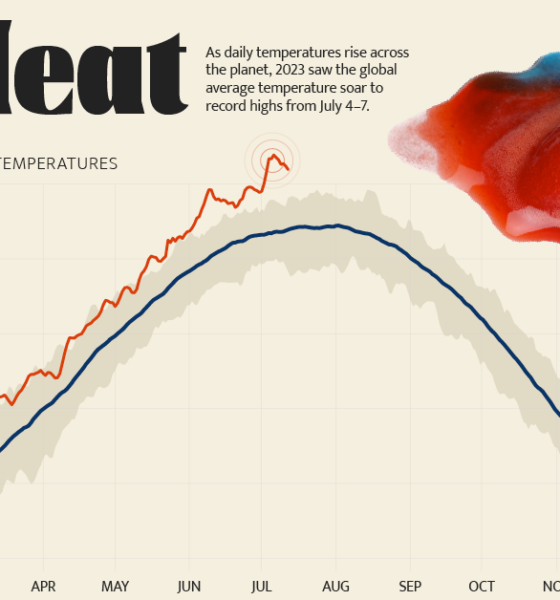
Four days straight in July 2023 set or equaled global temperature records on average.
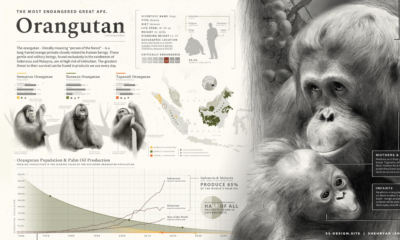

This graphic highlights the threats that pushed the world’s most endangered great apes to the brink, and what we can do to prevent their extinction.
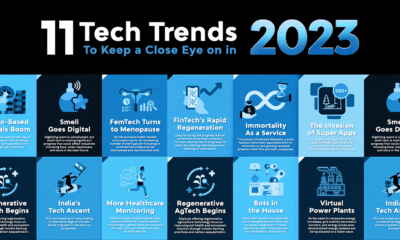

This infographic highlights eleven exciting areas within the world of technology worth keeping an eye on in 2023.
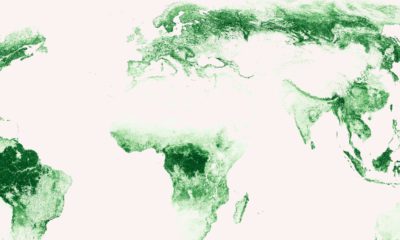

Where are the world's forests? These high-resolution maps show how the world’s carbon-sequestering forests are spread.


This infographic breaks down battery manufacturing capacity by country in 2022 and 2027.
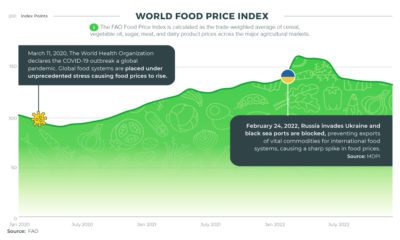

Many variables contribute to the rising cost of global food. Let's take a look at two major factors influencing food prices in recent years.
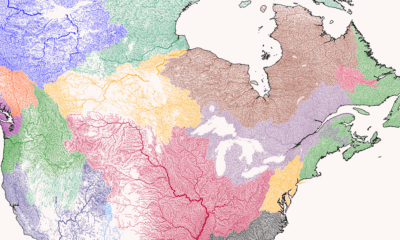

Where does each river start, converge, and end? This series of maps traces river basins in each continent around the world.
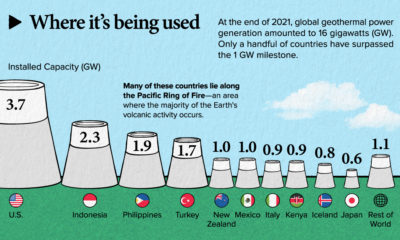

This infographic teaches you everything you need to know about geothermal energy in less than 5 minutes.
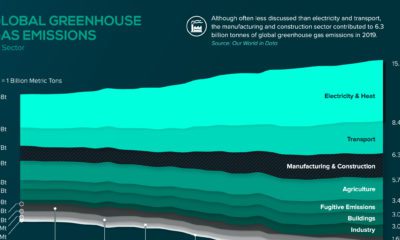

The manufacturing and construction sector contributed to 6.3 billion tonnes of global greenhouse gas emissions in 2019.
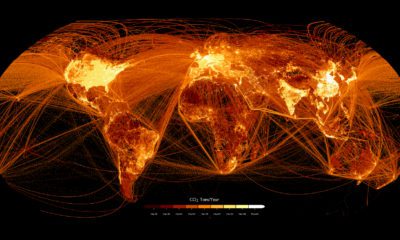

This graphic maps out carbon emissions around the world and where they come from, using data from the European Commission.
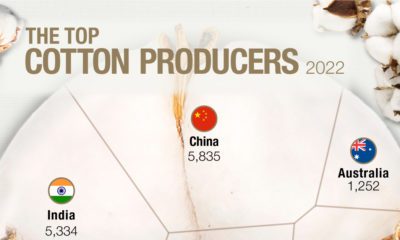

As the most-used natural fiber, cotton has become the most important non-food agricultural product.


 Creator Program