Healthcare
Animation: Global Life Expectancy (1950-2021)
Article/Editing:
Animated Chart: Global Life Expectancy (1950-2021)
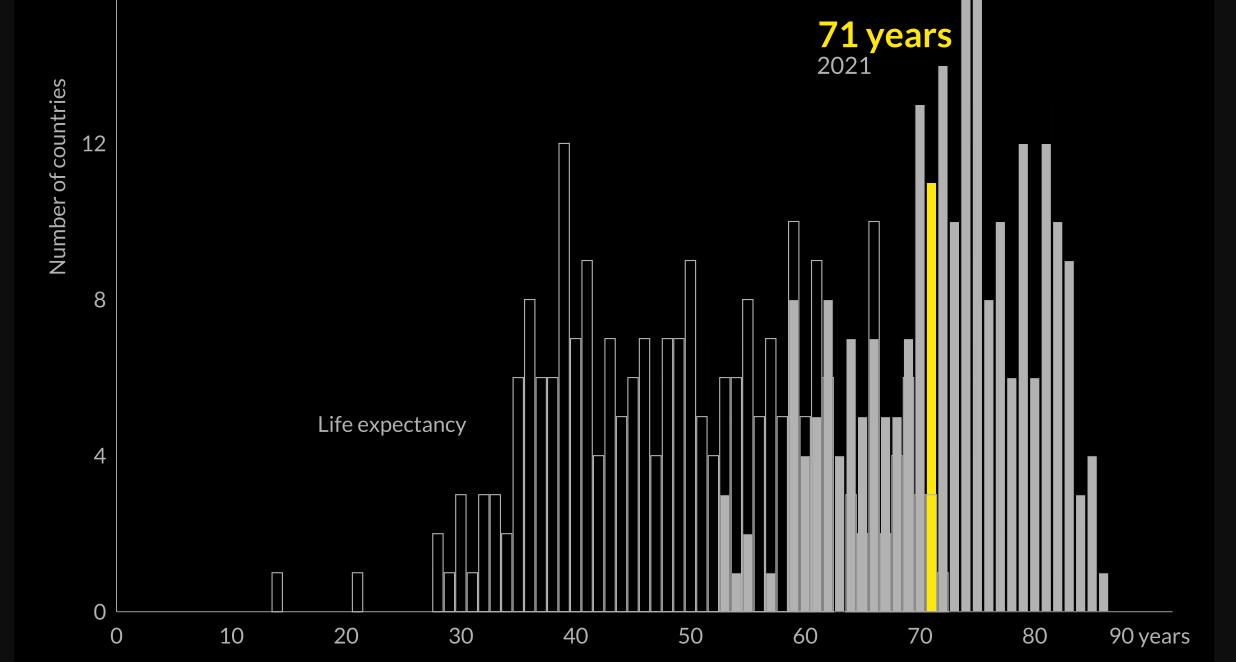
At a glance, life expectancy has been increasing worldwide over the last 70 years. But when you break it down by region and by sex, a clear yet variable gap in life expectancy emerges.
Using data from Our World in Data, these graphics by Pablo Alvarez provide both a breakdown of average life expectancies worldwide, as well as a more granular view that looks at the life expectancy of men and women across different continents.
Life Expectancy, by Continent and Sex
In the 1800s, the average life expectancy at birth was just 40 years.
Over the last 200 years, average life expectancies have nearly doubled, largely thanks to improvements in healthcare, sanitation, and global medical practices.
However, increases in life spans have not been consistent across the sexes—around the world, women now live 5.4 years longer than men do on average. And in certain parts of the world, this gap is even wider.
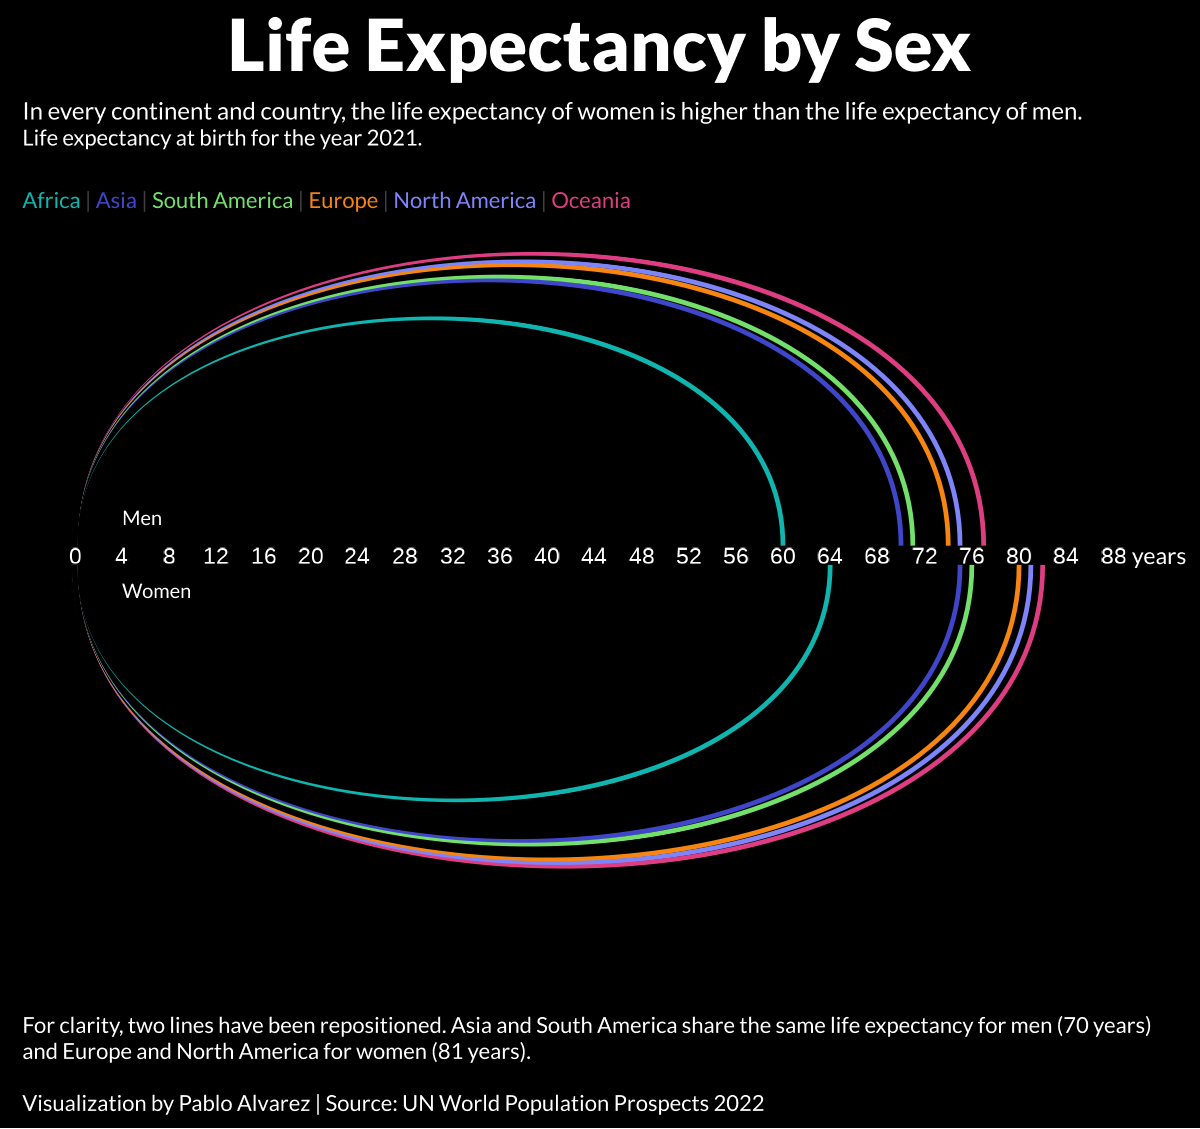
For instance, in South America, the average life expectancy for women is seven years longer than it is for men.
Here is the continental breakdown, with data by continent for both male and females:
| Life Expectancy by Region (2021) | Life expectancy at birth, females (years) | Life expectancy at birth, males (years) |
|---|---|---|
| Africa | 64 | 60 |
| Asia | 75 | 70 |
| Europe | 81 | 74 |
| North America | 81 | 75 |
| Oceania | 82 | 77 |
| South America | 76 | 70 |
| Global Average | 74 | 68 |
What’s causing this discrepancy in life expectancy between men and women?
Theories to Explain the Gap
While scientists don’t know the exact reason for the gap in average life expectancy between sexes, research has put forward a few leading theories. They indicate that the gap is caused by a mix of biological and societal influences:
Biological Factors
According to Our World in Data, there are several genetic and hormonal differences between men and women that may impact longevity.
Because of higher estrogen levels and chromosomal differences, women tend to have more “subcutaneous fat” in their bodies, which is fat that’s carried directly under their skin.
In contrast, men tend to have more “visceral fat,” or fat that surrounds internal organs—which is linked to cardiovascular disease, making men more prone to health risks like heart attacks.
Societal Factors
There are also a number of societal factors that could be contributing to lower life expectancy levels for men.
According to Dr. Perminder Sachdev, a professor of neuropsychiatry who studied human longevity, men are “more likely to smoke, drink excessively, and be overweight.” Dr. Sachdev adds that men are also “less likely to seek medical help early, and, if diagnosed with a disease, they are more likely to be non-adherent to treatment.”
In addition to these aggravated health risks, research also indicates that men are more likely to die in car crashes and fights than women. Further, they tend to disproportionately work in dangerous professions, with men being 10 times more likely to be killed on the job than women.
What’s the biggest contributor of all these factors? It’s worth noting that none of these theories are mutually exclusive, meaning it’s likely a mixture of all of the above—however, the weighting of each factor is currently unknown.

This article was published as a part of Visual Capitalist's Creator Program, which features data-driven visuals from some of our favorite Creators around the world.


Personal Finance
Ranked: The Best U.S. States for Retirement
Getting ready for retirement? See which states score the highest in terms of affordability, quality of life, and health care.
Ranked: The Best U.S. States for Retirement
What is the most important aspect of retirement planning?
If you said finances, you’re probably right. But have you ever thought about where the best place is to retire? Being strategic about location can make a big impact on your quality of life, and perhaps help your savings go just a bit further.
To help break it down, we’ve visualized data from personal finance platform, WalletHub, which ranked the best U.S. states for retirement as of 2023.
Data and Methodology
WalletHub ranked each state using 47 metrics across three dimensions.
- Affordability (7 metrics worth 40 points)
- Quality of Life (22 metrics worth 30 points)
- Health Care (18 metrics worth 30 points)
Here are some examples of what each dimension measures:
- Affordability: Cost of living and taxation
- Quality of Life: Quality of elder-abuse protections and crime rates
- Health Care: Number of health professionals per capita and life expectancy
Visit the source for the full list of metrics.
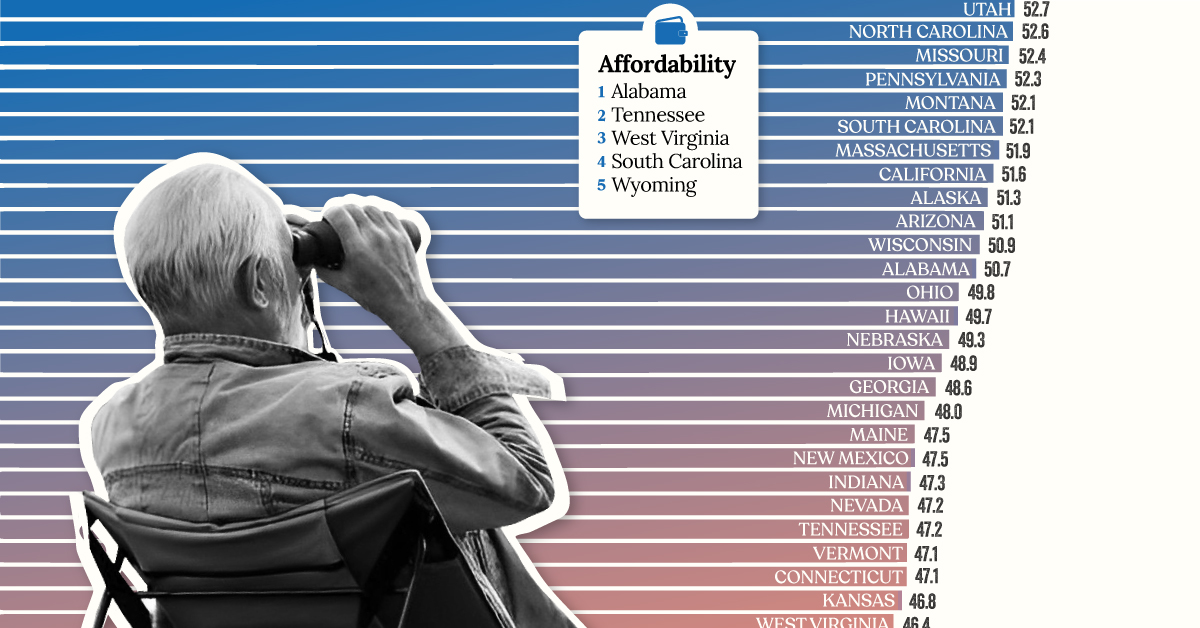
The final scores (visualized as the bars in the infographic above) represent each state’s weighted average across all metrics. See below for more comprehensive results.
| Rank | State | Score | Affordability (rank) | Quality of Life (rank) | Health Care (rank) |
|---|---|---|---|---|---|
| 1 | Virginia | 57.6 | 16 | 11 | 11 |
| 2T | Florida | 57.4 | 9 | 4 | 28 |
| 2T | Colorado | 57.4 | 14 | 27 | 5 |
| 4 | Wyoming | 55.6 | 5 | 9 | 38 |
| 5 | Delaware | 55.5 | 6 | 33 | 18 |
| 6 | New Hampshire | 55.0 | 31 | 5 | 7 |
| 7 | South Dakota | 53.6 | 25 | 30 | 9 |
| 8 | Minnesota | 53.5 | 40 | 2 | 1 |
| 9 | Idaho | 53.2 | 15 | 17 | 31 |
| 10 | North Dakota | 53.0 | 22 | 25 | 20 |
| 11 | Utah | 52.7 | 20 | 24 | 26 |
| 12 | North Carolina | 52.6 | 12 | 23 | 35 |
| 13 | Missouri | 52.4 | 17 | 28 | 32 |
| 14 | Pennsylvania | 52.3 | 36 | 3 | 12 |
| 15T | Montana | 52.1 | 24 | 15 | 29 |
| 15T | South Carolina | 52.1 | 4 | 38 | 39 |
| 17 | Massachusetts | 51.9 | 47 | 1 | 2 |
| 18 | California | 51.6 | 32 | 19 | 10 |
| 19 | Alaska | 51.3 | 26 | 36 | 8 |
| 20 | Arizona | 51.1 | 18 | 35 | 25 |
| 21 | Wisconsin | 50.9 | 34 | 14 | 17 |
| 22 | Alabama | 50.7 | 1 | 44 | 50 |
| 23 | Ohio | 49.8 | 27 | 8 | 37 |
| 24 | Hawaii | 49.7 | 38 | 29 | 4 |
| 25 | Nebraska | 49.3 | 37 | 16 | 15 |
| 26 | Iowa | 48.9 | 35 | 12 | 24 |
| 27 | Georgia | 48.6 | 7 | 40 | 42 |
| 28 | Michigan | 48.0 | 29 | 18 | 36 |
| 29T | Maine | 47.5 | 43 | 6 | 13 |
| 29T | New Mexico | 47.5 | 21 | 46 | 30 |
| 31 | Indiana | 47.3 | 23 | 31 | 40 |
| 32T | Nevada | 47.2 | 11 | 42 | 41 |
| 32T | Tennessee | 47.2 | 2 | 48 | 45 |
| 34T | Vermont | 47.1 | 48 | 7 | 6 |
| 34T | Connecticut | 47.1 | 44 | 26 | 3 |
| 36 | Kansas | 46.8 | 30 | 32 | 33 |
| 37 | West Virginia | 46.4 | 3 | 43 | 49 |
| 38 | Oregon | 46.1 | 41 | 21 | 21 |
| 39 | Texas | 45.9 | 28 | 37 | 34 |
| 40 | Rhode Island | 45.0 | 39 | 39 | 14 |
| 41 | Arkansas | 44.7 | 8 | 49 | 44 |
| 42 | Maryland | 44.6 | 46 | 20 | 19 |
| 43 | Washington | 44.5 | 45 | 13 | 23 |
| 44 | Illinois | 44.3 | 42 | 22 | 27 |
| 45 | Louisiana | 43.9 | 13 | 45 | 47 |
| 46 | New York | 43.7 | 50 | 10 | 16 |
| 47 | Oklahoma | 43.6 | 19 | 47 | 43 |
| 48 | Mississippi | 40.8 | 10 | 50 | 48 |
| 49 | New Jersey | 40.2 | 49 | 34 | 22 |
| 50 | Kentucky | 38.8 | 33 | 41 | 46 |
According to this methodology, Virginia is currently the best state for retirement. Although the Southeastern state does not excel in any one dimension, it scores consistently well across all three to create a very balanced retirement profile.
This gives it a slight advantage over second place Florida, which excels in quality of life and affordability, but falls further behind in terms of health care. Third-placed Colorado is a mirror of Florida, offering excellent health care but a lower quality of life in comparison.
How to Interpret These Results
It’s important to remember that this ranking is purely based on data and the methodology above, and may not be tailored to your individual preferences.
For example, if you believe that health services will be very important during retirement, you may rank Minnesota (#1 in terms of health care) much higher than eighth place.
You may notice that prioritizing one dimension will often come at a trade-off in others. Looking at Minnesota once more, we can see that the state is also one of America’s most expensive.
Looking to retire outside of the U.S.? Check out this graphic on the top 25 countries to retire in.

-

 Markets2 weeks ago
Visualizing 1 Billion Square Feet of Empty Office Space
-

 Environment4 weeks ago
Life Cycle Emissions: EVs vs. Combustion Engine Vehicles
-

 Maps2 weeks ago
Vintage Viz: The World’s Rivers and Lakes, Organized Neatly
-

 Markets3 weeks ago
Visualized: The 100 Largest U.S. Banks by Consolidated Assets
-

 Automation1 week ago
Charted: Changing Sentiments Towards AI in the Workplace
-

 Markets3 weeks ago
What are Top Investment Managers Holding in Their Portfolios?
-

 Stocks1 week ago
The 50 Best One-Year Returns on the S&P 500 (1980-2022)
-

 Markets3 weeks ago
Chart: U.S. Home Price Growth Over 50 Years