Countries
Charted: The World’s Aging Population from 1950 to 2100
Article/Editing:
Charted: The World’s Aging Population from 1950 to 2100
As demographics continue to shift in the 21st century, the world’s aging population will continue to be a focal point for many global decision makers.
Most countries around the world have experienced population explosions, or are about to. Combine this with declining birth rates and falling mortality rates, and it’s clear that the global senior population will continue to reach new heights.
These graphics by Pablo Alvarez use data from the 2022 UN World Population Prospects to visualize this increasing aging population across countries.
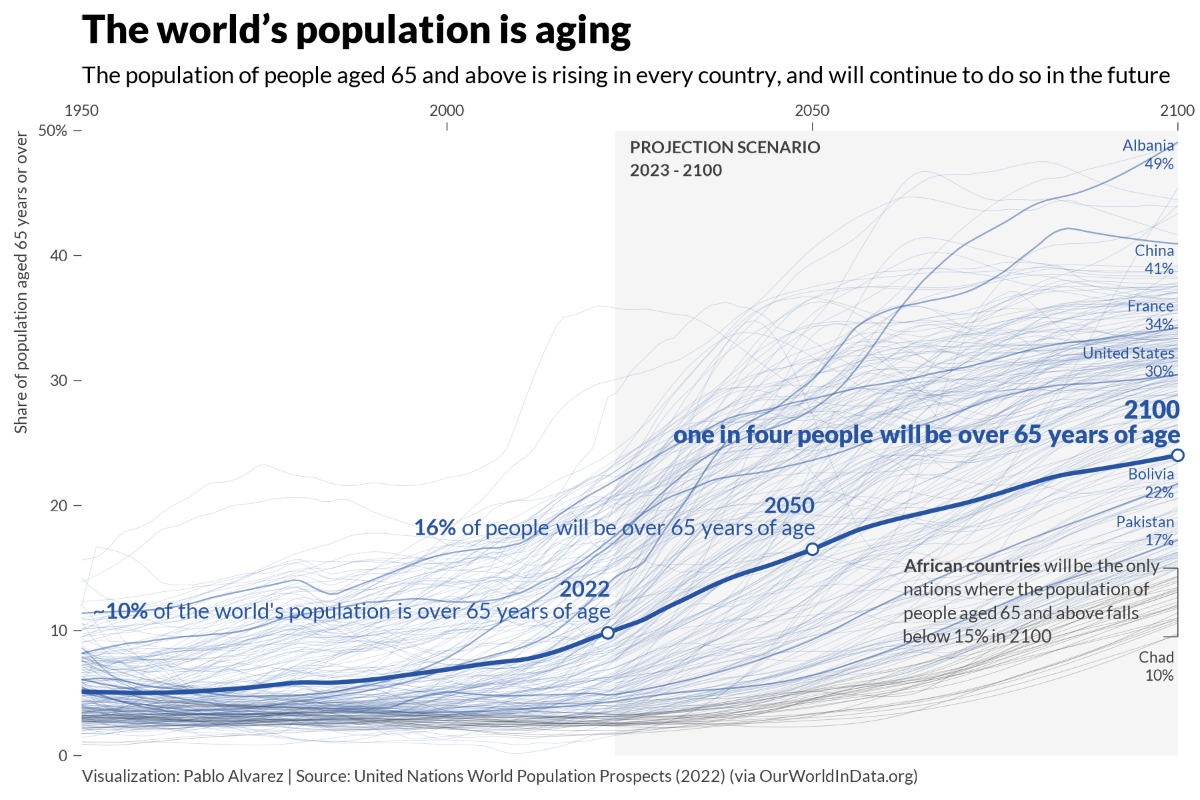
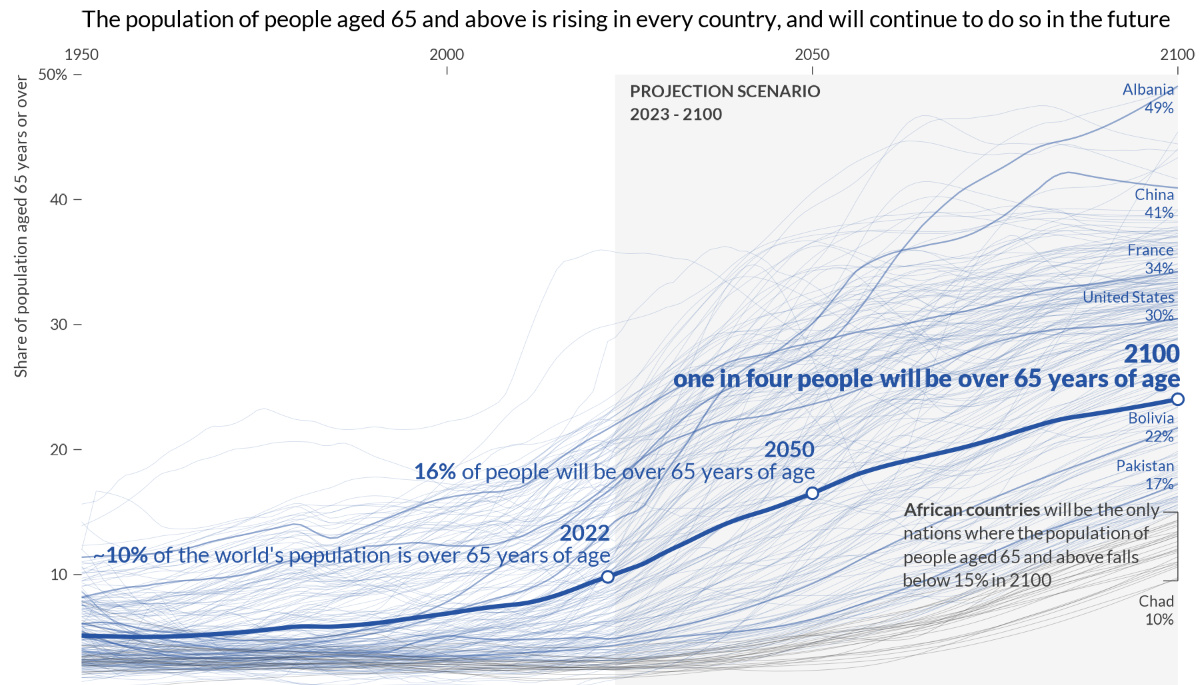
The World’s Aging Population from 1950 to 2100
In 2022, there were 771 million people aged 65+ years globally, accounting for almost 10% of the world’s population.
This segment has been growing at an increasing rate, and it’s expected to hit 16% in 2050, and eventually 24% by 2100. Here’s what that’s projected to look like, for every country and territory.
| Country by Population Aged +65 Years | 1950 | 2022 | 2100 |
|---|---|---|---|
| 🇦🇫 Afghanistan | 2.85% | 2.39% | 16.03% |
| 🇦🇱 Albania | 6.04% | 16.66% | 49.08% |
| 🇩🇿 Algeria | 3.49% | 6.39% | 28.83% |
| 🇦🇸 American Samoa | 2.38% | 7.27% | 45.41% |
| 🇦🇩 Andorra | 10.02% | 14.98% | 37.04% |
| 🇦🇴 Angola | 2.93% | 2.6% | 12.07% |
| 🇦🇮 Anguilla | 3.69% | 10.71% | 37.49% |
| 🇦🇬 Antigua and Barbuda | 4.14% | 10.63% | 35.4% |
| 🇦🇷 Argentina | 4.13% | 11.92% | 31.79% |
| 🇦🇲 Armenia | 8.17% | 13.15% | 36.13% |
| 🇦🇼 Aruba | 1.77% | 16.15% | 36.51% |
| 🇦🇺 Australia | 8.17% | 16.9% | 31.38% |
| 🇦🇹 Austria | 10.42% | 19.81% | 33.93% |
| 🇦🇿 Azerbaijan | 6.89% | 7.11% | 30.5% |
| 🇧🇸 Bahamas | 4.76% | 8.89% | 29.58% |
| 🇧🇭 Bahrain | 2.88% | 3.76% | 21.89% |
| 🇧🇩 Bangladesh | 3.9% | 6.04% | 32.56% |
| 🇧🇧 Barbados | 5.24% | 16.28% | 33.19% |
| 🇧🇾 Belarus | 8.24% | 17.18% | 30.45% |
| 🇧🇪 Belgium | 11.03% | 19.73% | 32.83% |
| 🇧🇿 Belize | 3.57% | 5.09% | 29.21% |
| 🇧🇯 Benin | 7.85% | 3.06% | 11.03% |
| 🇧🇲 Bermuda | 5.71% | 20.41% | 37.73% |
| 🇧🇹 Bhutan | 2.53% | 6.25% | 33.35% |
| 🇧🇴 Bolivia | 6.11% | 4.85% | 21.75% |
| 🇧🇶 Bonaire Sint Eustatius and Saba | 14.22% | 13.84% | 28.94% |
| 🇧🇦 Bosnia and Herzegovina | 3.95% | 18.4% | 36.4% |
| 🇧🇼 Botswana | 4.32% | 3.65% | 17.96% |
| 🇧🇷 Brazil | 2.39% | 9.88% | 33.52% |
| 🇻🇬 British Virgin Islands | 8.63% | 9.95% | 32.47% |
| 🇧🇳 Brunei | 4.85% | 6.17% | 30.93% |
| 🇧🇬 Bulgaria | 6.66% | 22.38% | 37.13% |
| 🇧🇫 Burkina Faso | 2.01% | 2.53% | 13.07% |
| 🇧🇮 Burundi | 3.22% | 2.48% | 13.23% |
| 🇰🇭 Cambodia | 2.67% | 5.81% | 26.43% |
| 🇨🇲 Cameroon | 3.47% | 2.67% | 11.89% |
| 🇨🇦 Canada | 7.7% | 19.03% | 31.55% |
| 🇨🇻 Cape Verde | 3.67% | 5.55% | 32.63% |
| 🇰🇾 Cayman Islands | 6.05% | 8.17% | 28.75% |
| 🇨🇫 Central African Republic | 5.% | 2.51% | 11.43% |
| 🇹🇩 Chad | 4.33% | 2.01% | 9.64% |
| 🇨🇱 Chile | 3.3% | 13.03% | 36.61% |
| 🇨🇳 China | 5.04% | 13.72% | 40.93% |
| 🇨🇴 Colombia | 3.22% | 9.% | 34.49% |
| 🇰🇲 Comoros | 3.8% | 4.28% | 17.81% |
| 🇨🇬 Congo | 3.36% | 2.72% | 11.99% |
| 🇨🇰 Cook Islands | 2.94% | 11.73% | 29.75% |
| 🇨🇷 Costa Rica | 2.97% | 10.83% | 36.99% |
| 🇨🇮 Cote d'Ivoire | 2.21% | 2.4% | 10.86% |
| 🇭🇷 Croatia | 7.82% | 22.36% | 37.03% |
| 🇨🇺 Cuba | 4.36% | 15.81% | 36.31% |
| 🇨🇼 Curacao | 5.82% | 14.95% | 30.46% |
| 🇨🇾 Cyprus | 5.95% | 14.83% | 33.36% |
| 🇨🇿 Czechia | 8.29% | 20.64% | 26.94% |
| 🇨🇩 Democratic Republic of Congo | 3.77% | 2.92% | 10.62% |
| 🇩🇰 Denmark | 9.04% | 20.49% | 30.45% |
| 🇩🇯 Djibouti | 1.99% | 4.54% | 19.68% |
| 🇩🇲 Dominica | 7.67% | 9.53% | 34.28% |
| 🇩🇴 Dominican Republic | 2.72% | 7.4% | 30.47% |
| 🇪🇨 Ecuador | 5.2% | 7.83% | 31.97% |
| 🇪🇬 Egypt | 2.95% | 4.83% | 21.77% |
| 🇸🇻 El Salvador | 3.93% | 8.22% | 36.02% |
| 🇬🇶 Equatorial Guinea | 5.53% | 3.12% | 15.13% |
| 🇪🇷 Eritrea | 3.2% | 4.01% | 19.86% |
| 🇪🇪 Estonia | 10.56% | 20.58% | 34.15% |
| 🇸🇿 Eswatini | 2.68% | 4.% | 16.26% |
| 🇪🇹 Ethiopia | 3.01% | 3.14% | 18.6% |
| 🇫🇴 Faeroe Islands | 7.59% | 17.92% | 26.91% |
| 🇫🇰 Falkland Islands | 8.27% | 11.08% | 35.86% |
| 🇫🇯 Fiji | 5.99% | 5.9% | 20.6% |
| 🇫🇮 Finland | 6.63% | 23.27% | 34.04% |
| 🇫🇷 France | 11.39% | 21.66% | 34.23% |
| 🇬🇫 French Guiana | 7.96% | 5.98% | 21.13% |
| 🇵🇫 French Polynesia | 3.% | 10.07% | 37.85% |
| 🇬🇦 Gabon | 7.21% | 3.89% | 16.25% |
| 🇬🇲 Gambia | 2.5% | 2.43% | 16.06% |
| 🇬🇪 Georgia | 9.35% | 14.61% | 31.19% |
| 🇩🇪 Germany | 9.46% | 22.41% | 33.72% |
| 🇬🇭 Ghana | 4.62% | 3.55% | 15.91% |
| 🇬🇮 Gibraltar | 6.94% | 20.84% | 37.63% |
| 🇬🇷 Greece | 6.8% | 22.82% | 37.52% |
| 🇬🇱 Greenland | 3.06% | 10.02% | 29.16% |
| 🇬🇩 Grenada | 5.12% | 10.07% | 30.54% |
| 🇬🇵 Guadeloupe | 5.51% | 20.04% | 34.45% |
| 🇬🇺 Guam | 1.11% | 11.84% | 31.19% |
| 🇬🇹 Guatemala | 2.31% | 4.91% | 28.05% |
| 🇬🇬 Guernsey | 11.96% | 16.64% | 35.4% |
| 🇬🇳 Guinea | 5.39% | 3.32% | 14.% |
| 🇬🇼 Guinea-Bissau | 3.45% | 2.82% | 14.34% |
| 🇬🇾 Guyana | 3.89% | 6.28% | 28.94% |
| 🇭🇹 Haiti | 3.64% | 4.54% | 19.07% |
| 🇭🇳 Honduras | 3.96% | 4.27% | 26.5% |
| 🇭🇰 Hong Kong | 2.48% | 20.47% | 41.64% |
| 🇭🇺 Hungary | 7.81% | 20.01% | 31.85% |
| 🇮🇸 Iceland | 7.52% | 15.33% | 34.25% |
| 🇮🇳 India | 3.1% | 6.9% | 29.81% |
| 🇮🇩 Indonesia | 1.74% | 6.86% | 25.28% |
| 🇮🇷 Iran | 5.22% | 7.62% | 33.72% |
| 🇮🇶 Iraq | 2.79% | 3.41% | 18.44% |
| 🇮🇪 Ireland | 10.99% | 15.14% | 32.48% |
| 🇮🇲 Isle of Man | 13.9% | 22.29% | 31.8% |
| 🇮🇱 Israel | 4.% | 12.04% | 25.97% |
| 🇮🇹 Italy | 8.09% | 24.05% | 38.19% |
| 🇯🇲 Jamaica | 3.83% | 7.45% | 44.05% |
| 🇯🇵 Japan | 4.89% | 29.92% | 38.7% |
| 🇯🇪 Jersey | 12.34% | 16.22% | 30.52% |
| 🇯🇴 Jordan | 5.03% | 3.84% | 27.3% |
| 🇰🇿 Kazakhstan | 6.47% | 8.04% | 19.58% |
| 🇰🇪 Kenya | 5.28% | 2.87% | 16.98% |
| 🇰🇮 Kiribati | 7.13% | 3.81% | 17.33% |
| 🇽🇰 Kosovo | 5.33% | 10.19% | 43.35% |
| 🇰🇼 Kuwait | 2.88% | 4.93% | 31.56% |
| 🇰🇬 Kyrgyzstan | 7.91% | 4.54% | 21.08% |
| 🇱🇦 Laos | 2.13% | 4.45% | 25.24% |
| 🇱🇻 Latvia | 10.12% | 21.86% | 32.86% |
| 🇱🇧 Lebanon | 7.24% | 9.89% | 32.11% |
| 🇱🇸 Lesotho | 6.34% | 4.2% | 13.44% |
| 🇱🇷 Liberia | 2.97% | 3.31% | 13.88% |
| 🇱🇾 Libya | 5.21% | 4.86% | 27.77% |
| 🇱🇮 Liechtenstein | 7.89% | 19.37% | 34.79% |
| 🇱🇹 Lithuania | 8.65% | 20.8% | 32.79% |
| 🇱🇺 Luxembourg | 9.71% | 15.03% | 31.55% |
| 🇲🇴 Macao | 3.11% | 13.% | 32.39% |
| 🇲🇬 Madagascar | 3.25% | 3.35% | 16.21% |
| 🇲🇼 Malawi | 3.06% | 2.61% | 15.61% |
| 🇲🇾 Malaysia | 4.91% | 7.5% | 30.78% |
| 🇲🇻 Maldives | 3.14% | 4.78% | 35.61% |
| 🇲🇱 Mali | 2.78% | 2.38% | 11.% |
| 🇲🇹 Malta | 7.42% | 19.13% | 38.26% |
| 🇲🇭 Marshall Islands | 5.68% | 4.56% | 17.8% |
| 🇲🇶 Martinique | 5.85% | 22.77% | 37.31% |
| 🇲🇷 Mauritania | 1.44% | 3.22% | 15.03% |
| 🇲🇺 Mauritius | 3.18% | 12.79% | 33.76% |
| 🇾🇹 Mayotte | 6.61% | 2.88% | 18.15% |
| 🇲🇽 Mexico | 2.99% | 8.32% | 34.88% |
| 🇫🇲 Micronesia (country) | 4.11% | 6.16% | 27.59% |
| 🇲🇩 Moldova | 7.56% | 12.98% | 26.36% |
| 🇲🇨 Monaco | 15.64% | 35.92% | 30.16% |
| 🇲🇳 Mongolia | 3.87% | 4.61% | 26.18% |
| 🇲🇪 Montenegro | 7.85% | 16.55% | 34.16% |
| 🇲🇸 Montserrat | 7.92% | 17.7% | 33.05% |
| 🇲🇦 Morocco | 2.86% | 7.72% | 29.97% |
| 🇲🇿 Mozambique | 3.13% | 2.57% | 13.43% |
| 🇲🇲 Myanmar | 3.21% | 6.82% | 23.69% |
| 🇳🇦 Namibia | 4.1% | 3.97% | 15.38% |
| 🇳🇷 Nauru | 8.98% | 2.5% | 15.87% |
| 🇳🇵 Nepal | 2.74% | 6.09% | 29.51% |
| 🇳🇱 Netherlands | 7.76% | 20.31% | 32.89% |
| 🇳🇨 New Caledonia | 5.% | 11.02% | 31.61% |
| 🇳🇿 New Zealand | 9.09% | 16.31% | 33.2% |
| 🇳🇮 Nicaragua | 2.71% | 5.29% | 28.92% |
| 🇳🇪 Niger | .92% | 2.4% | 9.76% |
| 🇳🇬 Nigeria | 3.% | 2.97% | 12.31% |
| 🇳🇺 Niue | 4.79% | 15.16% | 22.55% |
| 🇰🇵 North Korea | 2.72% | 11.71% | 30.49% |
| 🇲🇰 North Macedonia | 5.87% | 14.91% | 36.56% |
| 🇲🇵 Northern Mariana Islands | 2.95% | 10.81% | 32.09% |
| 🇳🇴 Norway | 9.52% | 18.44% | 31.65% |
| 🇴🇲 Oman | 3.05% | 2.76% | 23.96% |
| 🇵🇰 Pakistan | 5.48% | 4.27% | 17.23% |
| 🇵🇼 Palau | 8.59% | 9.93% | 21.48% |
| 🇵🇸 Palestine | 4.77% | 3.53% | 23.44% |
| 🇵🇦 Panama | 3.57% | 8.77% | 30.03% |
| 🇵🇬 Papua New Guinea | 1.09% | 3.19% | 16.81% |
| 🇵🇾 Paraguay | 3.73% | 6.26% | 26.51% |
| 🇵🇪 Peru | 3.43% | 8.41% | 30.33% |
| 🇵🇭 Philippines | 3.56% | 5.44% | 23.38% |
| 🇵🇱 Poland | 5.22% | 18.55% | 35.69% |
| 🇵🇹 Portugal | 7.% | 22.9% | 36.28% |
| 🇵🇷 Puerto Rico | 3.63% | 22.93% | 48.9% |
| 🇶🇦 Qatar | 3.5% | 1.52% | 15.01% |
| 🇷🇪 Reunion | 3.81% | 13.28% | 32.4% |
| 🇷🇴 Romania | 7.16% | 18.64% | 32.22% |
| 🇷🇺 Russia | 4.8% | 15.8% | 27.86% |
| 🇷🇼 Rwanda | 2.76% | 3.2% | 17.36% |
| 🇧🇱 Saint Barthlemy | 7.3% | 10.61% | 43.89% |
| 🇸🇭 Saint Helena | 8.63% | 28.66% | 32.61% |
| 🇰🇳 Saint Kitts and Nevis | 5.36% | 10.13% | 29.79% |
| 🇱🇨 Saint Lucia | 3.59% | 9.23% | 33.39% |
| 🇲🇫 Saint Martin (French part) | 4.47% | 11.14% | 30.08% |
| 🇵🇲 Saint Pierre and Miquelon | 6.34% | 17.32% | 33.4% |
| 🇻🇨 Saint Vincent and the Grenadines | 7.71% | 10.86% | 32.34% |
| 🇼🇸 Samoa | 2.52% | 5.22% | 18.75% |
| 🇸🇲 San Marino | 10.15% | 20.47% | 35.73% |
| 🇸🇹 Sao Tome and Principe | 3.92% | 3.76% | 15.6% |
| 🇸🇦 Saudi Arabia | 3.32% | 2.81% | 30.28% |
| 🇸🇳 Senegal | 3.42% | 3.14% | 16.54% |
| 🇷🇸 Serbia | 6.15% | 20.56% | 37.55% |
| 🇸🇨 Seychelles | 10.68% | 8.16% | 28.84% |
| 🇸🇱 Sierra Leone | 3.02% | 3.14% | 15.52% |
| 🇸🇬 Singapore | 2.29% | 15.12% | 36.51% |
| 🇸🇽 Sint Maarten (Dutch part) | 12.03% | 10.57% | 34.51% |
| 🇸🇰 Slovakia | 6.63% | 16.98% | 33.4% |
| 🇸🇮 Slovenia | 7.52% | 20.96% | 33.59% |
| 🇸🇧 Solomon Islands | 4.03% | 3.47% | 15.29% |
| 🇸🇴 Somalia | 2.6% | 2.57% | 10.75% |
| 🇿🇦 South Africa | 4.06% | 5.89% | 20.55% |
| 🇰🇷 South Korea | 2.74% | 17.49% | 44.44% |
| 🇸🇸 South Sudan | 3.48% | 2.89% | 13.11% |
| 🇪🇸 Spain | 7.23% | 20.27% | 38.72% |
| 🇱🇰 Sri Lanka | 8.76% | 11.54% | 35.73% |
| 🇸🇩 Sudan | 3.03% | 3.5% | 13.28% |
| 🇸🇷 Suriname | 4.09% | 7.39% | 25.8% |
| 🇸🇪 Sweden | 10.19% | 20.25% | 31.83% |
| 🇨🇭 Switzerland | 9.49% | 19.31% | 32.61% |
| 🇸🇾 Syria | 7.66% | 4.68% | 24.62% |
| 🇹🇼 Taiwan | 2.11% | 16.71% | 37.32% |
| 🇹🇯 Tajikistan | 4.34% | 3.47% | 19.43% |
| 🇹🇿 Tanzania | 2.2% | 3.1% | 14.97% |
| 🇹🇭 Thailand | 3.21% | 15.21% | 39.17% |
| 🇹🇱 Timor | 3.14% | 5.21% | 25.42% |
| 🇹🇬 Togo | 4.29% | 3.13% | 11.77% |
| 🇹🇰 Tokelau | 4.7% | 8.66% | 25.03% |
| 🇹🇴 Tonga | 4.6% | 6.22% | 21.65% |
| 🇹🇹 Trinidad and Tobago | 3.93% | 11.52% | 32.67% |
| 🇹🇳 Tunisia | 4.4% | 9.02% | 31.24% |
| 🇹🇷 Turkey | 3.77% | 8.64% | 33.9% |
| 🇹🇲 Turkmenistan | 5.84% | 5.15% | 21.55% |
| 🇹🇨 Turks and Caicos Islands | 5.79% | 10.34% | 28.25% |
| 🇹🇻 Tuvalu | 4.98% | 6.48% | 16.15% |
| 🇺🇬 Uganda | 2.87% | 1.69% | 14.33% |
| 🇺🇦 Ukraine | 7.54% | 18.81% | 33.2% |
| 🇦🇪 United Arab Emirates | 3.35% | 1.83% | 15.77% |
| 🇬🇧 United Kingdom | 10.84% | 19.17% | 32.56% |
| 🇺🇸 United States | 8.18% | 17.13% | 30.47% |
| 🇻🇮 United States Virgin Islands | 7.54% | 20.42% | 39.11% |
| 🇺🇾 Uruguay | 8.23% | 15.58% | 35.98% |
| 🇺🇿 Uzbekistan | 5.87% | 5.14% | 22.24% |
| 🇻🇺 Vanuatu | 5.65% | 3.74% | 16.29% |
| 🇻🇪 Venezuela | 2.29% | 8.61% | 27.71% |
| 🇻🇳 Vietnam | 4.13% | 9.12% | 30.02% |
| 🇼🇫 Wallis and Futuna | 1.76% | 13.47% | 32.98% |
| 🇪🇭 Western Sahara | 2.82% | 5.84% | 23.73% |
| 🇾🇪 Yemen | 3.98% | 2.66% | 18.25% |
| 🇿🇲 Zambia | 2.76% | 1.75% | 12.66% |
| 🇿🇼 Zimbabwe | 3.18% | 3.32% | 14.22% |
| 🌐 World | 5.13% | 9.82% | 24.03% |
Some of the places with high elderly shares today include high-income countries like Japan (30%), Italy (24%), and Finland (23%).
The lowest shares are concentrated in the Middle East and Africa. Many countries have just 2% of their population aged 65 years and older, such as Qatar, Uganda, and Afghanistan.
But over time, almost all countries are expected to see their older population segments grow. In just three decades, it is estimated that one-in-four European, North American, and Asian residents will be over 65 years of age.
By 2100, a variety of Asian countries and island nations facing low population growth are expected to see more than one-third of their populations aged 65 years or older, including South Korea and Jamaica at 44%. However, it’s actually Albania that’s the biggest outlier overall, with a projected 49% of its population to be aged 65 and older by 2100.
Passing the Generational Torch
The challenge of an aging population is set to impact all sectors of society, including labor and financial markets, demand for housing and transportation, and especially family structures and intergenerational ties.
One way to help grasp the nature of transition is to note the changing ratio between seniors and young children in the world population, as seen in the below crossover diagram:
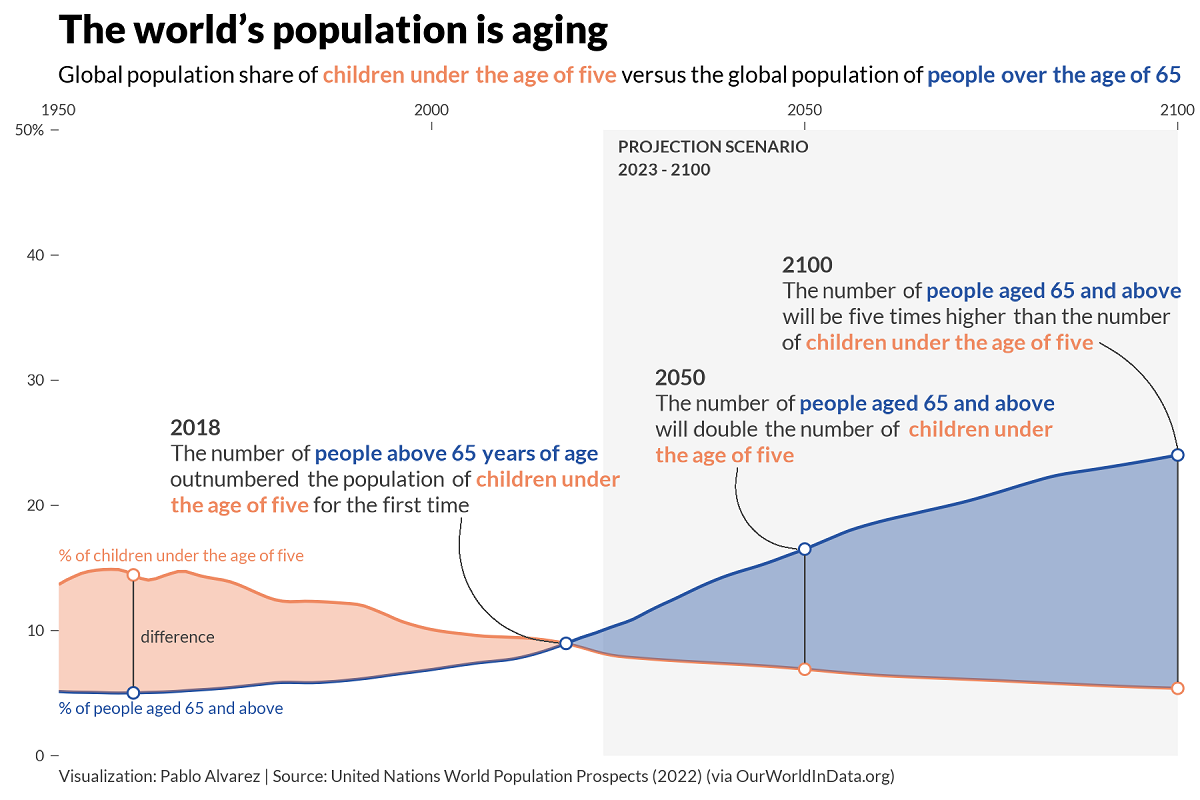
Dropping fertility rates, in addition to improved child and infant mortality rates, are known to have played a major role in the plateauing population of children.
However, not all countries have witnessed this crossover yet, as it usually coincides with higher levels of economic development.
As countries such as India, Brazil, and South Africa reach higher levels of per capita income, they will be likely to follow down the paths of more advanced economies, eventually experiencing similar demographic fates and challenges.

This article was published as a part of Visual Capitalist's Creator Program, which features data-driven visuals from some of our favorite Creators around the world.


Countries
Mapped: World’s Top 40 Largest Military Budgets
War in Europe has caused Ukraine’s military spend to jump up by 640%. How do the world’s largest military budgets compare?
Mapped: World’s Top 40 Largest Military Budgets
In the final year of World War II, the U.S. spent about 38% of its GDP on its military. When adjusted for inflation, the military budget over those four years of war came to a staggering $4.1 trillion in 2020 dollars.
Almost 80 years later, modern day military spending isn’t much of a far cry from World War II budgets. The top spenders have continued to increase their military capabilities, while war in Ukraine has caused countries in the region to re-evaluate their budgets as well.
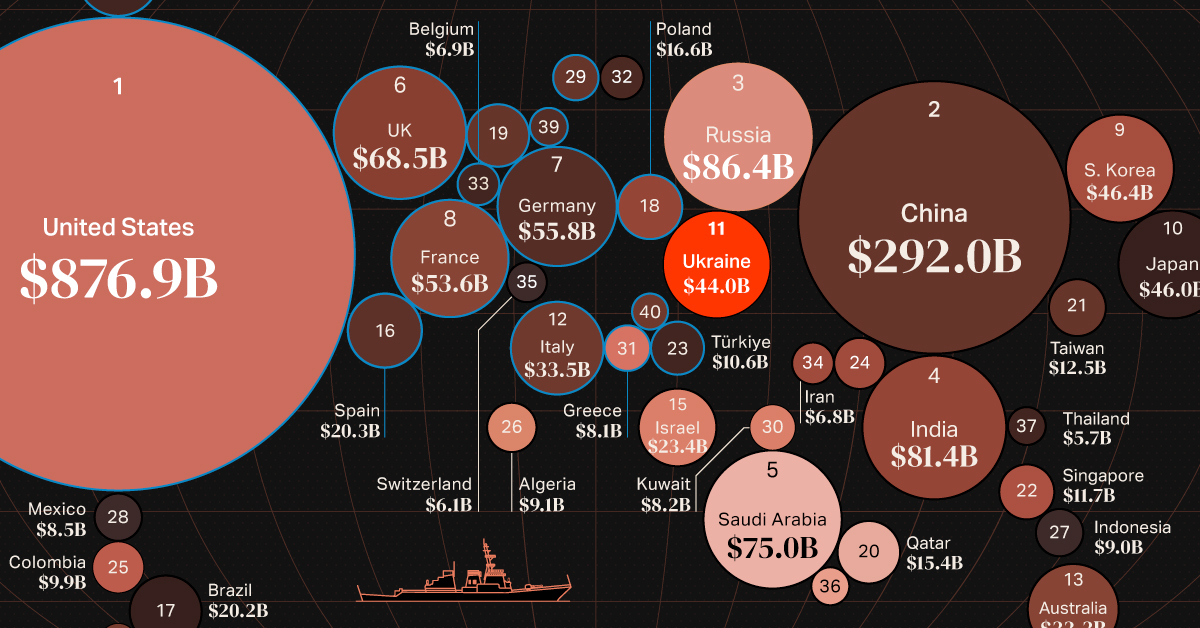
In 2022, global military budgets hit an all-time high of $2.2 trillion, according to data released by Stockholm International Peace Research Institute (SIPRI), the eighth consecutive year of increase. This post looks at the top 40 largest military budgets in the world.
The Largest Military Budgets in 2022
The United States accounts for almost 40% of global military expenditures, with its 2022 spend coming to $877 billion.
Here are the top 40 largest military budgets in the world for 2022 in U.S. dollars:
| Rank | Country | Military Budget (Billions) | % of World Military Spend |
|---|---|---|---|
| 1 | 🇺🇸 U.S. | $876.9 | 39.0% |
| 2 | 🇨🇳 China | $292.0 | 13.0% |
| 3 | 🇷🇺 Russia | $86.4 | 3.9% |
| 4 | 🇮🇳 India | $81.4 | 3.6% |
| 5 | 🇸🇦 Saudi Arabia | $75.0 | 3.3% |
| 6 | 🇬🇧 UK | $68.5 | 3.1% |
| 7 | 🇩🇪 Germany | $55.8 | 2.5% |
| 8 | 🇫🇷 France | $53.6 | 2.4% |
| 9 | 🇰🇷 South Korea | $46.4 | 2.1% |
| 10 | 🇯🇵 Japan | $46.0 | 2.1% |
| 11 | 🇺🇦 Ukraine | $44.0 | 2.0% |
| 12 | 🇮🇹 Italy | $33.5 | 1.5% |
| 13 | 🇦🇺 Australia | $32.3 | 1.4% |
| 14 | 🇨🇦 Canada | $26.9 | 1.2% |
| 15 | 🇮🇱 Israel | $23.4 | 1.0% |
| 16 | 🇪🇸 Spain | $20.3 | 0.9% |
| 17 | 🇧🇷 Brazil | $20.2 | 0.9% |
| 18 | 🇵🇱 Poland | $16.6 | 0.7% |
| 19 | 🇳🇱 Netherlands | $15.6 | 0.7% |
| 20 | 🇶🇦 Qatar | $15.4 | 0.7% |
| 21 | 🇹🇼 Taiwan | $12.5 | 0.6% |
| 22 | 🇸🇬 Singapore | $11.7 | 0.5% |
| 23 | 🇹🇷 Türkiye | $10.6 | 0.5% |
| 24 | 🇵🇰 Pakistan | $10.3 | 0.5% |
| 25 | 🇨🇴 Colombia | $9.9 | 0.4% |
| 26 | 🇩🇿 Algeria | $9.1 | 0.4% |
| 27 | 🇮🇩 Indonesia | $9.0 | 0.4% |
| 28 | 🇲🇽 Mexico | $8.5 | 0.4% |
| 29 | 🇳🇴 Norway | $8.4 | 0.4% |
| 30 | 🇰🇼 Kuwait | $8.2 | 0.4% |
| 31 | 🇬🇷 Greece | $8.1 | 0.4% |
| 32 | 🇸🇪 Sweden | $7.7 | 0.3% |
| 33 | 🇧🇪 Belgium | $6.9 | 0.3% |
| 34 | 🇮🇷 Iran | $6.8 | 0.3% |
| 35 | 🇨🇭 Switzerland | $6.1 | 0.3% |
| 36 | 🇴🇲 Oman | $5.8 | 0.3% |
| 37 | 🇹🇭 Thailand | $5.7 | 0.3% |
| 38 | 🇨🇱 Chile | $5.6 | 0.2% |
| 39 | 🇩🇰 Denmark | $5.5 | 0.2% |
| 40 | 🇷🇴 Romania | $5.2 | 0.2% |
China, ranked second in absolute terms, accounts for another 13% of world military expenditure at $292 billion.
Russia, India and Saudi Arabia round out the top five biggest military budgets in 2022. Add in the UK to the mix (#6 rank), and these countries all had military expenditures that made up at least 3% of global spend.
Comparatively, the lowest budgets on the top 40 ranged include Romania at $5.2 billion, Denmark at $5.5 billion, and Chile at $5.6 billion. They each account for just 0.2% of the world’s military budgets in 2022, and of course there are many countries with even smaller spends.
Largest Military Budget Increases in 2022
Russia’s position as the third-largest military spender is a recent development, as the country’s military spend had a 9% increase between 2021 and 2022, according to SIPRI estimates.
On the other side of Russia’s invasion, Ukraine was the top 40 military budget with the largest annual increase in 2022, surging nearly six and a half times above its 2021 expenditures.
| Country | % Change (2021-2022) | Rank Change (2021-2022) |
|---|---|---|
| 🇺🇦 Ukraine | 640% | +25 |
| 🇶🇦 Qatar | 27% | +2 |
| 🇸🇦 Saudi Arabia | 16% | +3 |
| 🇧🇪 Belgium | 13% | 0 |
| 🇳🇱 Netherlands | 12% | 0 |
| 🇸🇪 Sweden | 12% | -1 |
| 🇵🇱 Poland | 11% | 0 |
| 🇷🇺 Russia | 9.2% | +2 |
| 🇩🇰 Denmark | 8.8% | +3 |
| 🇪🇸 Spain | 7.3% | -1 |
| 🇳🇴 Norway | 6.2% | 0 |
| 🇮🇳 India | 6.0% | -1 |
| 🇯🇵 Japan | 5.9% | -1 |
| 🇮🇷 Iran | 4.6% | +5 |
| 🇨🇳 China | 4.2% | 0 |
| 🇬🇧 UK | 3.7% | -2 |
| 🇨🇦 Canada | 3.0% | -1 |
| 🇸🇬 Singapore | 2.8% | +1 |
| 🇩🇪 Germany | 2.3% | 0 |
| 🇮🇩 Indonesia | 1.3% | 0 |
| 🇨🇴 Colombia | 1.1% | -1 |
| 🇺🇸 U.S. | 0.7% | 0 |
| 🇫🇷 France | 0.6% | -2 |
| 🇬🇷 Greece | 0.6% | -1 |
| 🇨🇭 Switzerland | 0.4% | -1 |
| 🇹🇼 Taiwan | 0.4% | -1 |
| 🇦🇺 Australia | 0.3% | -1 |
| 🇵🇰 Pakistan | -2.0% | -3 |
| 🇰🇷 South Korea | -2.5% | +1 |
| 🇷🇴 Romania | -2.6% | +1 |
| 🇴🇲 Oman | -3.0% | +1 |
| 🇩🇿 Algeria | -3.7% | -1 |
| 🇮🇱 Israel | -4.2% | -1 |
| 🇮🇹 Italy | -4.5% | -1 |
| 🇨🇱 Chile | -6.2% | -3 |
| 🇧🇷 Brazil | -7.9% | -1 |
| 🇲🇽 Mexico | -9.7% | 0 |
| 🇰🇼 Kuwait | -11% | -4 |
| 🇹🇭 Thailand | -11% | -5 |
| 🇹🇷 Türkiye | -26% | -6 |
Ukraine’s dramatic increase represents the highest single-year jump ever recorded by SIPRI, painting a vivid before-and-after picture of a nation engaged in conflict.
Although no other country comes close in matching Ukraine’s surge in defense spending, Qatar saw a substantial increase of 27% over the last year, marking a continuing trend over the last decade of significantly bolstering its military.
Additionally, Saudi Arabia, along with four European nations (Belgium, the Netherlands, Sweden, and Poland), have registered year-over-year changes of over 10%.
On the flipside, 13 of the nations with the largest military budgets decreased spend from 2021, including top 15 spenders such as South Korea, Italy, and Israel.
The largest drop was seen by Türkiye, with an estimated 26% reduction in military budget. This drop may be linked to Türkiye’s inflation problem, which saw prices rise 72.3% in 2022—effectively decreasing the purchasing power of their currency in relative terms to other nations.
The Specter of War in Europe
With an ongoing conflict in the region and large financial powerhouses, its no surprise that eight of the top 10 countries with the most significant increases in military spending are located in Europe.
Consequently, European military budgets have reached levels not witnessed since the end of the Cold War.
And amid escalating geopolitical concerns, countries in Asia such as India, Japan, and China have also ramped up their defense spending. This is an indication of simmering global flashpoints such as India and China’s border skirmishes, the longstanding South China Sea territorial conflict, and concerns surrounding Taiwan’s sovereignty.
Source: Stockholm International Peace Research Institute (SIPRI).
Data note: SIPRI’s military expenditure data collection began in 1949, thus its records do not account for all expenditure that occurred during both World Wars.
Please see SIPRI’s methodologies page for more details on how they collect their data and create estimates.

-

 Energy3 weeks ago
How Old Are the World’s Nuclear Reactors?
-

 Countries7 days ago
Mapped: World’s Top 40 Largest Military Budgets
-

 Energy3 weeks ago
How Big is the Market for Crude Oil?
-

 United States6 days ago
Mapped: The Safest Cities in the U.S.
-

 Markets2 weeks ago
Ranked: The Most Profitable U.S. Companies, by Sector
-

 Technology5 days ago
How Long it Took for Popular Apps to Reach 100 Million Users
-

 Markets4 weeks ago
The World’s Biggest Mutual Fund and ETF Providers
-

 Brands2 weeks ago
Brand Reputations: Ranking the Best and Worst in 2023