Maps
Mapped: Renewable Energy and Battery Installations in the U.S. in 2023
![]() Subscribe to the Elements free mailing list for more like this
Subscribe to the Elements free mailing list for more like this
Renewable and Battery Installations in the U.S. in 2023
This was originally posted on Elements. Sign up to the free mailing list to get beautiful visualizations on real assets and resource megatrends each week.
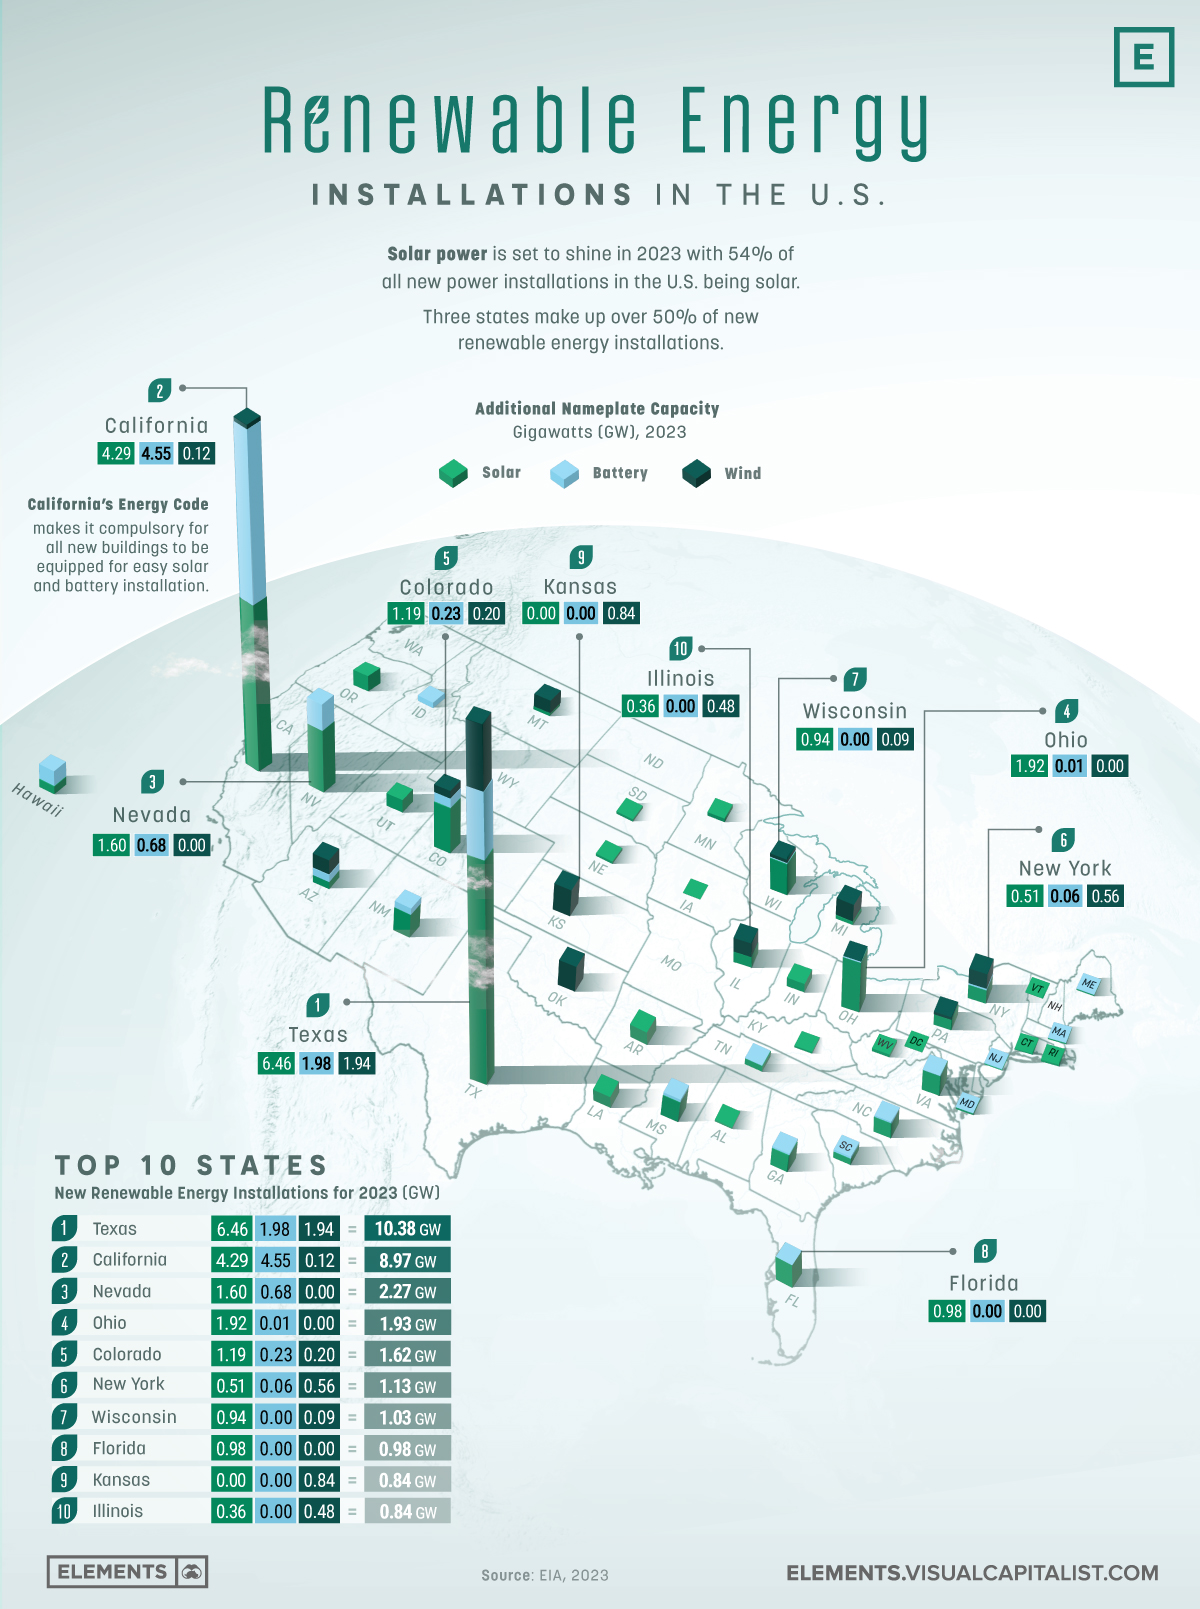
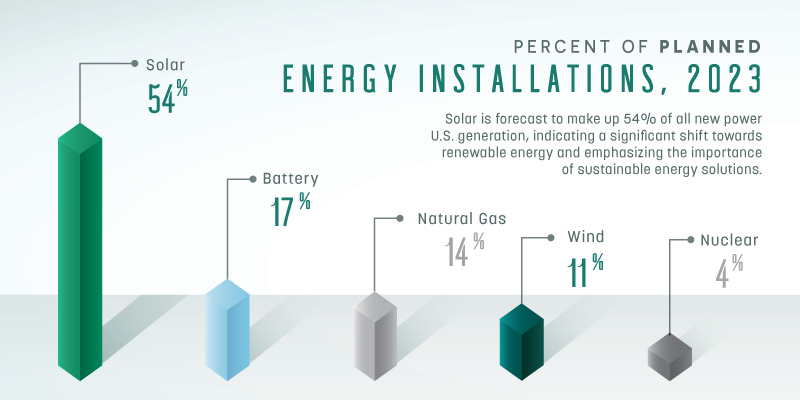
Renewable energy, in particular solar power, is set to shine in 2023. This year, the U.S. plans to get over 80% of its new energy installations from sources like battery, solar, and wind.
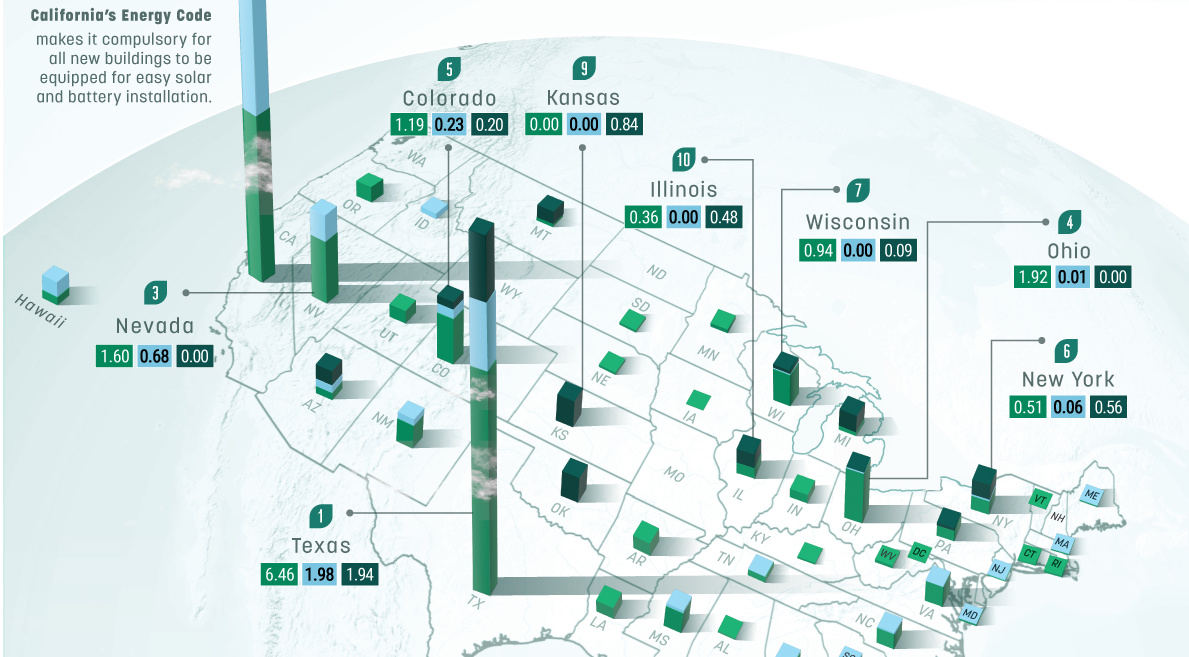
The above map uses data from EIA to highlight planned U.S. renewable energy and battery storage installations by state for 2023.
Texas and California Leading in Renewable Energy
Nearly every state in the U.S. has plans to produce new clean energy in 2023, but it’s not a surprise to see the two most populous states in the lead of the pack.
Even though the majority of its power comes from natural gas, Texas currently leads the U.S. in planned renewable energy installations. The state also has plans to power nearly 900,000 homes using new wind energy.
California is second, which could be partially attributable to the passing of Title 24, an energy code that makes it compulsory for new buildings to have the equipment necessary to allow the easy installation of solar panels, battery storage, and EV charging.
New solar power in the U.S. isn’t just coming from places like Texas and California. In 2023, Ohio will add 1,917 MW of new nameplate solar capacity, with Nevada and Colorado not far behind.
| Top 10 States | Battery (MW) | Solar (MW) | Wind (MW) | Total (MW) |
|---|---|---|---|---|
| Texas | 1,981 | 6,462 | 1,941 | 10,385 |
| California | 4,555 | 4,293 | 123 | 8,970 |
| Nevada | 678 | 1,596 | 0 | 2,274 |
| Ohio | 12 | 1,917 | 5 | 1,934 |
| Colorado | 230 | 1,187 | 200 | 1,617 |
| New York | 58 | 509 | 559 | 1,125 |
| Wisconsin | 4 | 939 | 92 | 1,034 |
| Florida | 3 | 978 | 0 | 980 |
| Kansas | 0 | 0 | 843 | 843 |
| Illinois | 0 | 363 | 477 | 840 |
The state of New York is also looking to become one of the nation’s leading renewable energy providers. The New York State Energy Research & Development Authority (NYSERDA) is making real strides towards this objective with 11% of the nation’s new wind power projects expected to come online in 2023.
According to the data, New Hampshire is the only state in the U.S. that has no new utility-scale renewable energy installations planned for 2023. However, the state does have plans for a massive hydroelectric plant that should come online in 2024.
Decarbonizing Energy
Renewable energy is considered essential to reduce global warming and CO2 emissions.
In line with the efforts by each state to build new renewable installations, the Biden administration has set a goal of achieving a carbon pollution-free power sector by 2035 and a net zero emissions economy by no later than 2050.
The EIA forecasts the share of U.S. electricity generation from renewable sources rising from 22% in 2022 to 23% in 2023 and to 26% in 2024.


Agriculture
Mapped: Meat Consumption By Country and Type
By examining meat consumption by country, we uncover regional differences in how much, and what type of meat people around the world prefer.
 Creator Program
Mapped: Meat Consumption By Country and Type
Meat is always on the menu in many parts of the world, as we can see when we map out meat consumption by country.
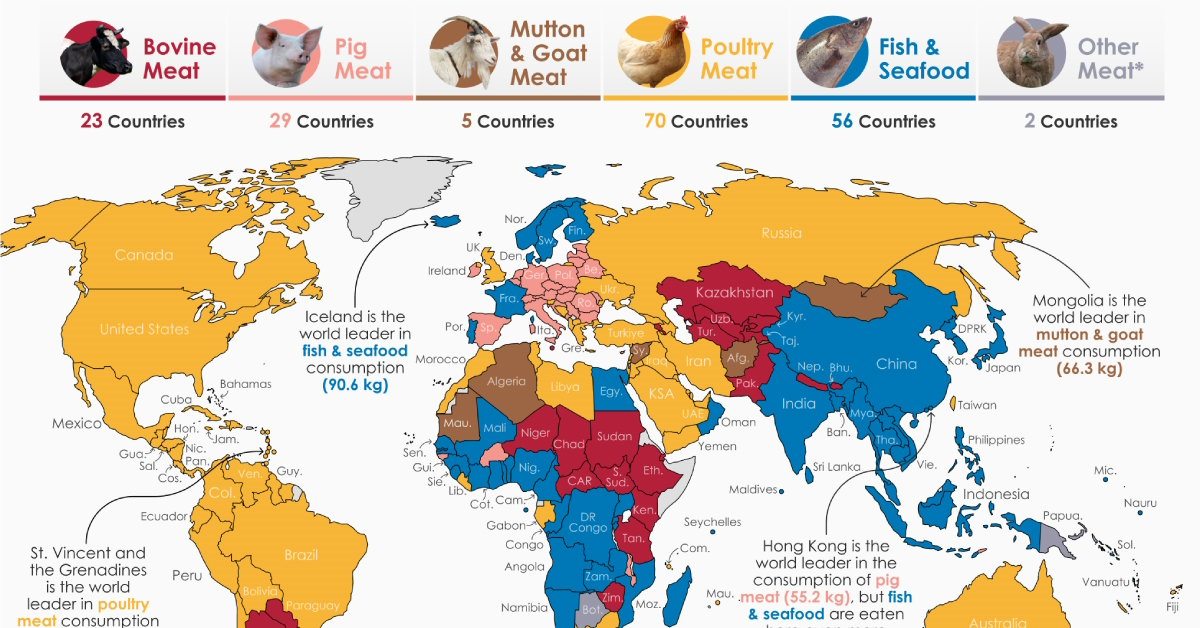
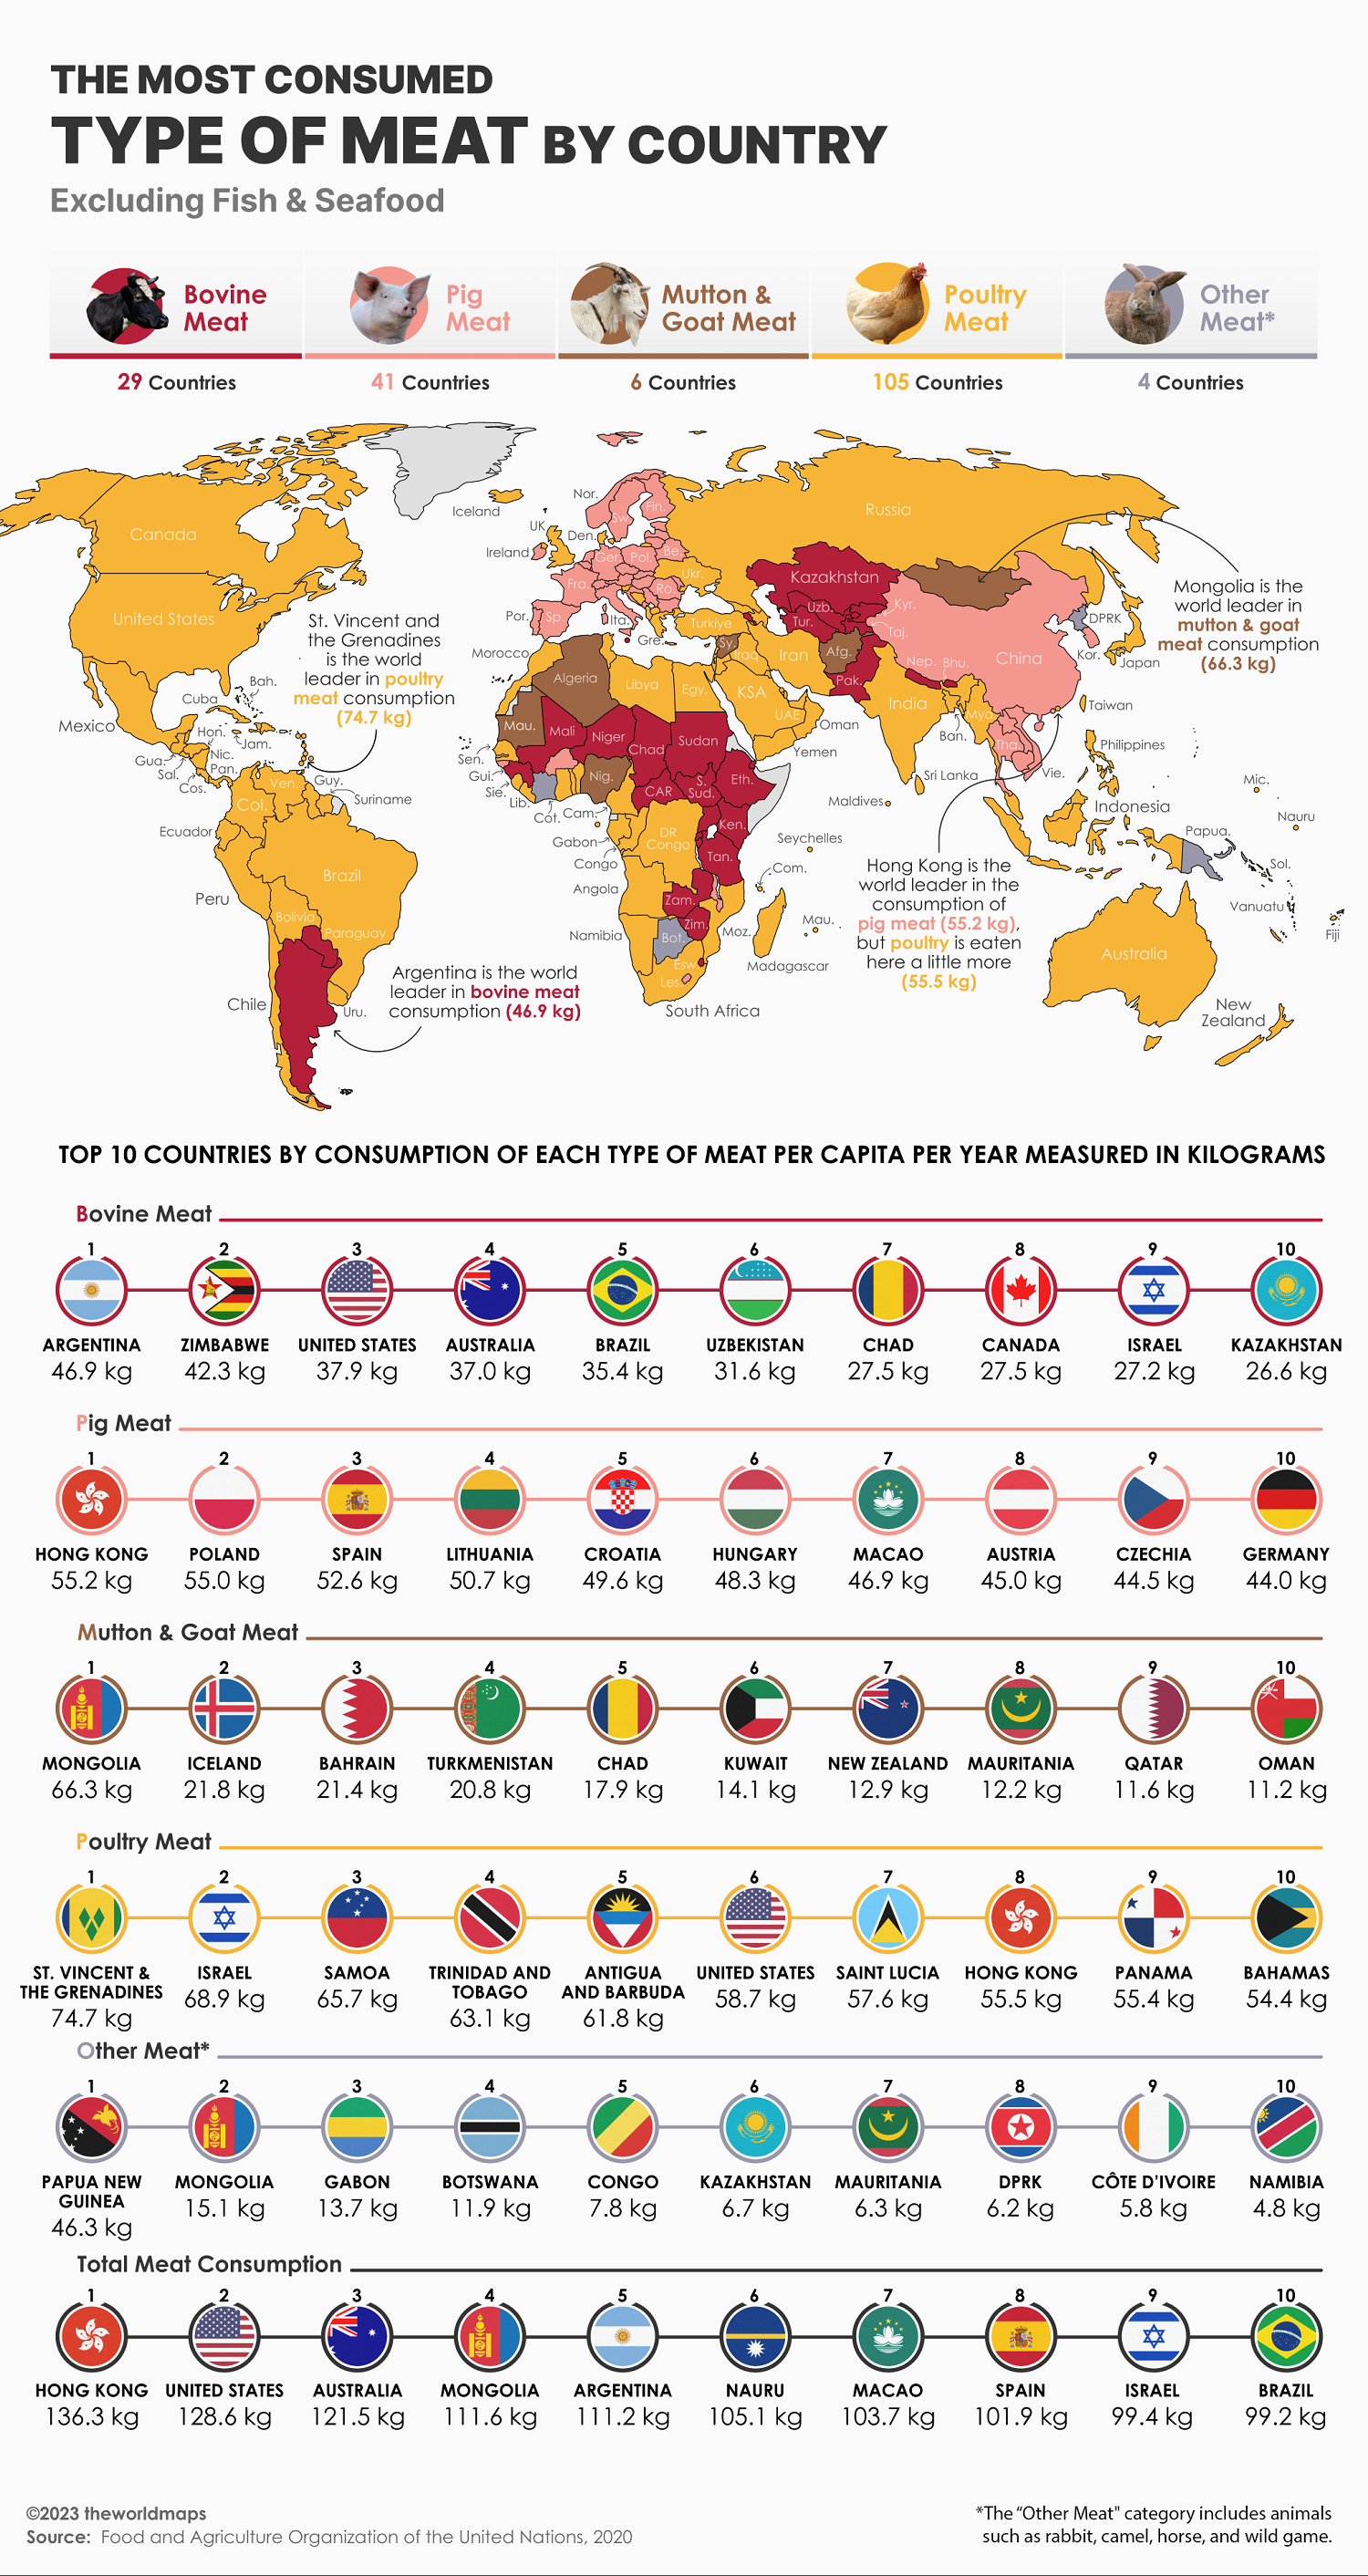
How do countries differ in how much, and what type of meat, they eat? In this colorful graphic, our creator theWORLDMAPS highlights the most consumed type of meat in every country in the world, using data from the UN’s Food and Agriculture Organization (FAO).
Each color denotes a different category of meat—beef, pork, mutton, poultry, seafood, or other—with annual consumption calculated per capita in kilograms (kg).
Let’s dig in to the data.
Is Fish Considered Meat?
Since meat is normally defined as the flesh of any animal (with the primary components being water, fat, and protein), that includes fish and other seafood.
But whether fish is considered “meat” or not depends a lot on cultural practices and dietary preferences, and has varied throughout history. Some earlier definitions of meat focused only on mammals, for example.
In Christianity for example, many denominations allow eating fish on fasting days when abstaining from meat. This was both due to distinctions between meat from warm-blooded land animals and cold-blooded animals (like fish), as well as the importance of fish consumption in parts of Europe where Christianity flourished.
To account for both sides of the debate, we’ll cover meat consumption by country both with and without fish and seafood.
The Most Consumed Meat by Country (Including Seafood)
Just by glancing at the map and the below table, poultry stands out as the most popular meat by weight consumption in 70 countries, or about 40% of the entire database.
Note: Other meat includes less frequently farmed animals like rabbit, horse, and camel, as well as game—meat from wild animals.
| Country | Most Consumed Meat |
|---|---|
| 🇦🇫 Afghanistan | Mutton & Goat |
| 🇦🇱 Albania | Poultry |
| 🇩🇿 Algeria | Mutton & Goat |
| 🇦🇴 Angola | Fish & Seafood |
| 🇦🇬 Antigua & Barbuda | Poultry |
| 🇦🇷 Argentina | Bovine |
| 🇦🇲 Armenia | Bovine |
| 🇦🇺 Australia | Poultry |
| 🇦🇹 Austria | Pork |
| 🇦🇿 Azerbaijan | Poultry |
| 🇧🇸 Bahamas | Poultry |
| 🇧🇭 Bahrain | Poultry |
| 🇧🇩 Bangladesh | Fish & Seafood |
| 🇧🇧 Barbados | Poultry |
| 🇧🇾 Belarus | Pork |
| 🇧🇪 Belgium | Pork |
| 🇧🇿 Belize | Poultry |
| 🇧🇯 Benin | Fish & Seafood |
| 🇧🇹 Bhutan | Bovine |
| 🇧🇴 Bolivia | Poultry |
| 🇧🇦 Bosnia & Herzegovina | Poultry |
| 🇧🇼 Botswana | Other |
| 🇧🇷 Brazil | Poultry |
| 🇧🇬 Bulgaria | Pork |
| 🇧🇫 Burkina Faso | Pork |
| 🇧🇮 Burundi | Fish & Seafood |
| 🇨🇻 Cabo Verde | Poultry |
| 🇰🇭 Cambodia | Fish & Seafood |
| 🇨🇲 Cameroon | Fish & Seafood |
| 🇨🇦 Canada | Poultry |
| 🇨🇫 Central African Republic | Bovine |
| 🇹🇩 Chad | Bovine |
| 🇨🇱 Chile | Poultry |
| 🇨🇳 China | Fish & Seafood |
| 🇨🇴 Colombia | Poultry |
| 🇰🇲 Comoros | Poultry |
| 🇨🇬 Congo | Fish & Seafood |
| 🇨🇷 Costa Rica | Poultry |
| 🇨🇮 Côte d’Ivoire | Fish & Seafood |
| 🇭🇷 Croatia | Pork |
| 🇨🇺 Cuba | Poultry |
| 🇨🇾 Cyprus | Pork |
| 🇨🇿 Czechia | Pork |
| 🇩🇰 Denmark | Fish & Seafood |
| 🇩🇯 Djibouti | Bovine |
| 🇩🇲 Dominica | Poultry |
| 🇩🇴 Dominican Republic | Poultry |
| 🇨🇩 DR Congo | Fish & Seafood |
| 🇪🇨 Ecuador | Poultry |
| 🇪🇬 Egypt | Fish & Seafood |
| 🇸🇻 El Salvador | Poultry |
| 🇪🇪 Estonia | Pork |
| 🇸🇿 Eswatini | Bovine |
| 🇪🇹 Ethiopia | Bovine |
| 🇫🇯 Fiji | Poultry |
| 🇫🇮 Finland | Fish & Seafood |
| 🇫🇷 France | Fish & Seafood |
| 🇵🇫 French Polynesia | Poultry |
| 🇬🇦 Gabon | Poultry |
| 🇬🇲 Gambia | Fish & Seafood |
| 🇬🇪 Georgia | Poultry |
| 🇩🇪 Germany | Pork |
| 🇬🇭 Ghana | Fish & Seafood |
| 🇬🇷 Greece | Poultry |
| 🇬🇩 Grenada | Poultry |
| 🇬🇹 Guatemala | Poultry |
| 🇬🇳 Guinea | Fish & Seafood |
| 🇬🇼 Guinea-Bissau | Pork |
| 🇬🇾 Guyana | Poultry |
| 🇭🇹 Haiti | Poultry |
| 🇭🇳 Honduras | Poultry |
| 🇭🇰 Hong Kong | Fish & Seafood |
| 🇭🇺 Hungary | Pork |
| 🇮🇸 Iceland | Fish & Seafood |
| 🇮🇳 India | Fish & Seafood |
| 🇮🇩 Indonesia | Fish & Seafood |
| 🇮🇷 Iran | Poultry |
| 🇮🇶 Iraq | Poultry |
| 🇮🇪 Ireland | Pork |
| 🇮🇱 Israel | Poultry |
| 🇮🇹 Italy | Pork |
| 🇯🇲 Jamaica | Poultry |
| 🇯🇵 Japan | Fish & Seafood |
| 🇯🇴 Jordan | Poultry |
| 🇰🇿 Kazakhstan | Bovine |
| 🇰🇪 Kenya | Bovine |
| 🇰🇮 Kiribati | Fish & Seafood |
| 🇰🇼 Kuwait | Poultry |
| 🇰🇬 Kyrgyzstan | Bovine |
| 🇱🇦 Laos | Fish & Seafood |
| 🇱🇻 Latvia | Pork |
| 🇱🇧 Lebanon | Poultry |
| 🇱🇸 Lesotho | Pork |
| 🇱🇷 Liberia | Poultry |
| 🇱🇾 Libya | Poultry |
| 🇱🇹 Lithuania | Pork |
| 🇱🇺 Luxembourg | Pork |
| 🇲🇴 Macao | Fish & Seafood |
| 🇲🇬 Madagascar | Fish & Seafood |
| 🇲🇼 Malawi | Pork |
| 🇲🇾 Malaysia | Fish & Seafood |
| 🇲🇻 Maldives | Fish & Seafood |
| 🇲🇱 Mali | Fish & Seafood |
| 🇲🇹 Malta | Bovine |
| 🇲🇷 Mauritania | Mutton & Goat |
| 🇲🇺 Mauritius | Poultry |
| 🇲🇽 Mexico | Poultry |
| 🇫🇲 Micronesia | Fish & Seafood |
| 🇲🇩 Moldova | Pork |
| 🇲🇳 Mongolia | Mutton & Goat |
| 🇲🇪 Montenegro | Pork |
| 🇲🇦 Morocco | Poultry |
| 🇲🇿 Mozambique | Fish & Seafood |
| 🇲🇲 Myanmar | Fish & Seafood |
| 🇳🇦 Namibia | Fish & Seafood |
| 🇳🇷 Nauru | Fish & Seafood |
| 🇳🇵 Nepal | Bovine |
| 🇳🇱 Netherlands | Pork |
| 🇳🇨 New Caledonia | Poultry |
| 🇳🇿 New Zealand | Fish & Seafood |
| 🇳🇮 Nicaragua | Poultry |
| 🇳🇪 Niger | Bovine |
| 🇳🇬 Nigeria | Fish & Seafood |
| 🇰🇵 North Korea | Fish & Seafood |
| 🇲🇰 North Macedonia | Poultry |
| 🇳🇴 Norway | Fish & Seafood |
| 🇴🇲 Oman | Fish & Seafood |
| 🇵🇰 Pakistan | Bovine |
| 🇵🇦 Panama | Poultry |
| 🇵🇬 Papua New Guinea | Other |
| 🇵🇾 Paraguay | Bovine |
| 🇵🇪 Peru | Poultry |
| 🇵🇭 Philippines | Fish & Seafood |
| 🇵🇱 Poland | Pork |
| 🇵🇹 Portugal | Fish & Seafood |
| 🇶🇦 Qatar | Poultry |
| 🇷🇴 Romania | Pork |
| 🇷🇺 Russia | Poultry |
| 🇷🇼 Rwanda | Fish & Seafood |
| 🇰🇳 Saint Kitts & Nevis | Poultry |
| 🇱🇨 Saint Lucia | Poultry |
| 🇻🇨 Saint Vincent & the Grenadines | Poultry |
| 🇼🇸 Samoa | Poultry |
| 🇸🇹 Sao Tome & Principe | Fish & Seafood |
| 🇸🇦 Saudi Arabia | Poultry |
| 🇸🇳 Senegal | Fish & Seafood |
| 🇷🇸 Serbia | Pork |
| 🇸🇨 Seychelles | Fish & Seafood |
| 🇸🇱 Sierra Leone | Fish & Seafood |
| 🇸🇰 Slovakia | Pork |
| 🇸🇮 Slovenia | Poultry |
| 🇸🇧 Solomon Islands | Fish & Seafood |
| 🇿🇦 South Africa | Poultry |
| 🇰🇷 South Korea | Fish & Seafood |
| 🇸🇸 South Sudan | Bovine |
| 🇪🇸 Spain | Pork |
| 🇱🇰 Sri Lanka | Fish & Seafood |
| 🇸🇩 Sudan | Bovine |
| 🇸🇷 Suriname | Poultry |
| 🇸🇪 Sweden | Fish & Seafood |
| 🇨🇭 Switzerland | Pork |
| 🇸🇾 Syria | Mutton & Goat |
| 🇹🇼 Taiwan | Poultry |
| 🇹🇯 Tajikistan | Bovine |
| 🇹🇿 Tanzania | Bovine |
| 🇹🇭 Thailand | Fish & Seafood |
| 🇹🇱 Timor-Leste | Pork |
| 🇹🇬 Togo | Fish & Seafood |
| 🇹🇹 Trinidad & Tobago | Poultry |
| 🇹🇳 Tunisia | Poultry |
| 🇹🇷 Türkiye | Poultry |
| 🇹🇲 Turkmenistan | Bovine |
| 🇺🇸 U.S. | Poultry |
| 🇦🇪 UAE | Poultry |
| 🇺🇬 Uganda | Fish & Seafood |
| 🇬🇧 UK | Poultry |
| 🇺🇦 Ukraine | Poultry |
| 🇺🇾 Uruguay | Poultry |
| 🇺🇿 Uzbekistan | Bovine |
| 🇻🇺 Vanuatu | Fish & Seafood |
| 🇻🇪 Venezuela | Poultry |
| 🇻🇳 Vietnam | Fish & Seafood |
| 🇾🇪 Yemen | Poultry |
| 🇿🇲 Zambia | Fish & Seafood |
| 🇿🇼 Zimbabwe | Bovine |
Fish & Seafood ranks as the second most popularly consumed meat in 56 countries, most of them with significant coastlines.
Here’s a breakdown of how much of each type of meat is eaten per capita in each country, measured in kilograms.
| Country | Poultry | Pork | Fish & Seafood | Bovine | Mutton & Other |
|---|---|---|---|---|---|
| 🇦🇫 Afghanistan | 1.7 | 0.0 | 0.4 | 3.2 | 4.3 |
| 🇦🇱 Albania | 13.9 | 5.3 | 8.7 | 11.7 | 8.3 |
| 🇩🇿 Algeria | 6.4 | 0.0 | 3.8 | 3.8 | 8.4 |
| 🇦🇴 Angola | 8.4 | 7.0 | 14.1 | 3.4 | 1.1 |
| 🇦🇬 Antigua & Barbuda | 61.8 | 14.3 | 54.1 | 5.0 | 1.0 |
| 🇦🇷 Argentina | 46.2 | 14.4 | 6.8 | 46.9 | 2.6 |
| 🇦🇲 Armenia | 15.3 | 8.1 | 5.5 | 23.9 | 3.6 |
| 🇦🇺 Australia | 48.7 | 24.2 | 24.1 | 37.0 | 11.5 |
| 🇦🇹 Austria | 15.7 | 45.0 | 14.3 | 14.9 | 1.4 |
| 🇦🇿 Azerbaijan | 14.4 | 0.6 | 2.0 | 13.5 | 8.4 |
| 🇧🇸 Bahamas | 54.4 | 23.8 | 24.2 | 5.2 | 1.7 |
| 🇧🇭 Bahrain | 44.0 | 0.8 | 16.3 | 13.7 | 22.2 |
| 🇧🇩 Bangladesh | 1.6 | 0.0 | 26.7 | 1.3 | 1.4 |
| 🇧🇧 Barbados | 49.3 | 12.3 | 42.9 | 8.0 | 3.4 |
| 🇧🇾 Belarus | 32.2 | 39.2 | 11.8 | 18.6 | 0.4 |
| 🇧🇪 Belgium | 12.4 | 32.8 | 22.7 | 14.0 | 2.6 |
| 🇧🇿 Belize | 23.8 | 20.8 | 13.3 | 3.6 | 0.3 |
| 🇧🇯 Benin | 8.7 | 0.7 | 16.2 | 3.6 | 1.5 |
| 🇧🇹 Bhutan | 4.6 | 1.9 | 7.3 | 9.3 | 0.3 |
| 🇧🇴 Bolivia | 40.9 | 9.7 | 2.8 | 21.6 | 4.9 |
| 🇧🇦 Bosnia & Herzegovina | 20.0 | 9.3 | 7.3 | 12.8 | 0.6 |
| 🇧🇼 Botswana | 3.5 | 0.5 | 2.6 | 10.2 | 14.3 |
| 🇧🇷 Brazil | 48.4 | 14.2 | 8.1 | 35.4 | 1.2 |
| 🇧🇬 Bulgaria | 21.5 | 30.0 | 7.4 | 3.5 | 2.0 |
| 🇧🇫 Burkina Faso | 9.5 | 15.2 | 8.9 | 5.3 | 4.3 |
| 🇧🇮 Burundi | 0.6 | 0.9 | 2.6 | 0.9 | 0.8 |
| 🇨🇻 Cabo Verde | 19.4 | 7.3 | 10.8 | 1.7 | 1.9 |
| 🇰🇭 Cambodia | 2.8 | 5.9 | 45.8 | 4.2 | 0.0 |
| 🇨🇲 Cameroon | 3.3 | 1.2 | 19.1 | 3.1 | 4.0 |
| 🇨🇦 Canada | 40.1 | 21.4 | 20.7 | 27.5 | 1.6 |
| 🇨🇫 Central African Republic | 2.6 | 4.1 | 7.4 | 20.8 | 10.4 |
| 🇹🇩 Chad | 0.5 | 0.2 | 6.6 | 27.5 | 18.7 |
| 🇨🇱 Chile | 36.1 | 22.1 | 14.8 | 23.7 | 1.3 |
| 🇨🇳 China | 15.6 | 35.5 | 39.9 | 6.8 | 4.2 |
| 🇨🇴 Colombia | 33.8 | 10.5 | 8.9 | 13.7 | 0.1 |
| 🇰🇲 Comoros | 26.8 | 0.1 | 14.3 | 3.0 | 1.2 |
| 🇨🇬 Congo | 23.2 | 6.8 | 24.5 | 1.9 | 8.1 |
| 🇨🇷 Costa Rica | 34.3 | 12.7 | 18.0 | 11.4 | 0.0 |
| 🇨🇮 Côte d’Ivoire | 2.9 | 1.0 | 23.2 | 1.4 | 6.5 |
| 🇭🇷 Croatia | 16.6 | 49.6 | 19.1 | 11.2 | 2.1 |
| 🇨🇺 Cuba | 37.7 | 21.6 | 6.1 | 7.4 | 4.9 |
| 🇨🇾 Cyprus | 28.4 | 36.8 | 25.5 | 5.9 | 4.6 |
| 🇨🇿 Czechia | 23.5 | 44.5 | 10.5 | 10.2 | 0.9 |
| 🇩🇰 Denmark | 24.6 | 13.5 | 26.5 | 24.3 | 1.3 |
| 🇩🇯 Djibouti | 3.6 | 0.1 | 3.5 | 6.2 | 5.4 |
| 🇩🇲 Dominica | 39.4 | 11.4 | 27.9 | 8.1 | 1.1 |
| 🇩🇴 Dominican Republic | 32.2 | 9.9 | 8.5 | 6.3 | 0.2 |
| 🇨🇩 DR Congo | 1.3 | 0.5 | 4.2 | 0.3 | 1.2 |
| 🇪🇨 Ecuador | 18.9 | 12.9 | 8.2 | 13.3 | 0.4 |
| 🇪🇬 Egypt | 14.3 | 0.0 | 27.1 | 7.4 | 1.5 |
| 🇸🇻 El Salvador | 25.9 | 4.7 | 6.5 | 8.2 | 0.0 |
| 🇪🇪 Estonia | 21.1 | 37.7 | 14.7 | 8.5 | 0.5 |
| 🇸🇿 Eswatini | 7.3 | 2.0 | 4.3 | 16.1 | 2.0 |
| 🇪🇹 Ethiopia | 0.6 | 0.0 | 0.5 | 3.8 | 3.5 |
| 🇫🇯 Fiji | 28.8 | 3.7 | 26.5 | 3.1 | 5.3 |
| 🇫🇮 Finland | 21.1 | 30.8 | 33.5 | 18.4 | 1.1 |
| 🇫🇷 France | 23.0 | 31.0 | 33.2 | 20.8 | 3.5 |
| 🇵🇫 French Polynesia | 48.8 | 14.3 | 47.3 | 21.4 | 3.7 |
| 🇬🇦 Gabon | 39.7 | 8.3 | 28.7 | 4.7 | 14.3 |
| 🇬🇲 Gambia | 10.6 | 0.3 | 25.2 | 3.4 | 1.1 |
| 🇬🇪 Georgia | 18.2 | 9.3 | 10.0 | 5.8 | 1.8 |
| 🇩🇪 Germany | 18.3 | 44.0 | 12.6 | 14.6 | 1.8 |
| 🇬🇭 Ghana | 11.6 | 1.2 | 24.9 | 1.6 | 4.2 |
| 🇬🇷 Greece | 25.6 | 25.0 | 21.7 | 14.5 | 9.4 |
| 🇬🇩 Grenada | 37.4 | 14.6 | 33.8 | 4.1 | 1.4 |
| 🇬🇹 Guatemala | 28.7 | 3.6 | 3.0 | 11.7 | 0.3 |
| 🇬🇳 Guinea | 2.7 | 0.2 | 9.7 | 8.2 | 2.8 |
| 🇬🇼 Guinea-Bissau | 3.1 | 7.2 | 1.2 | 3.7 | 1.3 |
| 🇬🇾 Guyana | 41.4 | 5.0 | 25.0 | 4.2 | 1.2 |
| 🇭🇹 Haiti | 10.9 | 4.0 | 5.0 | 4.2 | 0.9 |
| 🇭🇳 Honduras | 21.6 | 5.0 | 2.6 | 6.0 | 0.1 |
| 🇭🇰 Hong Kong | 55.5 | 55.2 | 65.8 | 22.5 | 3.0 |
| 🇭🇺 Hungary | 29.8 | 48.3 | 6.4 | 4.6 | 0.3 |
| 🇮🇸 Iceland | 30.0 | 21.8 | 90.6 | 14.0 | 24.4 |
| 🇮🇳 India | 2.6 | 0.2 | 8.0 | 1.1 | 0.6 |
| 🇮🇩 Indonesia | 13.7 | 0.9 | 44.4 | 2.8 | 0.5 |
| 🇮🇷 Iran | 26.0 | 0.0 | 12.6 | 7.6 | 4.5 |
| 🇮🇶 Iraq | 5.4 | 0.0 | 3.6 | 3.1 | 1.7 |
| 🇮🇪 Ireland | 24.7 | 31.1 | 22.6 | 19.8 | 3.6 |
| 🇮🇱 Israel | 68.9 | 1.6 | 24.7 | 27.2 | 1.7 |
| 🇮🇹 Italy | 19.6 | 32.9 | 29.2 | 15.9 | 1.8 |
| 🇯🇲 Jamaica | 53.9 | 3.1 | 25.2 | 3.8 | 0.7 |
| 🇯🇵 Japan | 22.3 | 21.3 | 46.2 | 9.6 | 0.3 |
| 🇯🇴 Jordan | 26.1 | 0.0 | 5.1 | 6.8 | 4.8 |
| 🇰🇿 Kazakhstan | 21.2 | 8.2 | 2.8 | 26.6 | 15.9 |
| 🇰🇪 Kenya | 1.3 | 0.4 | 2.9 | 4.5 | 4.5 |
| 🇰🇮 Kiribati | 26.6 | 10.3 | 73.2 | 1.9 | 0.3 |
| 🇰🇼 Kuwait | 46.6 | 0.0 | 14.0 | 9.4 | 16.7 |
| 🇰🇬 Kyrgyzstan | 5.2 | 2.1 | 1.1 | 14.9 | 10.0 |
| 🇱🇦 Laos | 6.6 | 13.5 | 24.1 | 8.4 | 0.5 |
| 🇱🇻 Latvia | 26.2 | 38.4 | 25.0 | 5.3 | 0.8 |
| 🇱🇧 Lebanon | 18.6 | 0.6 | 8.7 | 9.2 | 1.1 |
| 🇱🇸 Lesotho | 2.1 | 3.8 | 3.0 | 2.0 | 3.9 |
| 🇱🇷 Liberia | 11.3 | 5.3 | 4.3 | 0.4 | 2.1 |
| 🇱🇾 Libya | 32.8 | 0.0 | 14.3 | 2.9 | 6.5 |
| 🇱🇹 Lithuania | 33.3 | 50.7 | 33.1 | 5.9 | 1.1 |
| 🇱🇺 Luxembourg | 18.1 | 33.1 | 31.7 | 25.7 | 2.0 |
| 🇲🇴 Macao | 45.6 | 46.9 | 73.2 | 9.4 | 1.8 |
| 🇲🇬 Madagascar | 3.1 | 1.0 | 4.0 | 1.3 | 0.5 |
| 🇲🇼 Malawi | 5.7 | 11.8 | 10.1 | 2.9 | 3.1 |
| 🇲🇾 Malaysia | 50.2 | 7.4 | 54.7 | 6.0 | 1.0 |
| 🇲🇻 Maldives | 11.0 | 0.4 | 83.1 | 5.9 | 0.8 |
| 🇲🇱 Mali | 2.4 | 0.1 | 8.5 | 3.6 | 2.6 |
| 🇲🇹 Malta | 25.2 | 25.8 | 22.8 | 26.4 | 1.8 |
| 🇲🇷 Mauritania | 6.3 | 0.0 | 8.4 | 6.4 | 18.4 |
| 🇲🇺 Mauritius | 38.7 | 3.2 | 24.0 | 4.5 | 4.2 |
| 🇲🇽 Mexico | 35.9 | 19.1 | 13.6 | 14.6 | 1.5 |
| 🇫🇲 Micronesia | 38.2 | 16.2 | 47.4 | 4.9 | 0.2 |
| 🇲🇩 Moldova | 17.2 | 19.2 | 11.7 | 1.9 | 0.3 |
| 🇲🇳 Mongolia | 3.0 | 0.6 | 0.6 | 26.6 | 81.4 |
| 🇲🇪 Montenegro | 17.1 | 43.2 | 15.6 | 15.0 | 2.1 |
| 🇲🇦 Morocco | 24.0 | 0.0 | 18.4 | 7.7 | 6.9 |
| 🇲🇿 Mozambique | 3.8 | 3.1 | 13.4 | 0.6 | 0.1 |
| 🇲🇲 Myanmar | 29.9 | 20.1 | 45.0 | 9.3 | 1.7 |
| 🇳🇦 Namibia | 10.2 | 4.5 | 11.9 | 8.8 | 8.9 |
| 🇳🇷 Nauru | 51.0 | 28.2 | 51.0 | 19.1 | 6.9 |
| 🇳🇵 Nepal | 2.3 | 1.0 | 3.5 | 8.2 | 2.7 |
| 🇳🇱 Netherlands | 10.0 | 27.7 | 21.9 | 16.2 | 5.2 |
| 🇳🇨 New Caledonia | 40.9 | 17.4 | 23.4 | 17.7 | 2.3 |
| 🇳🇿 New Zealand | 26.0 | 25.2 | 26.4 | 18.6 | 15.3 |
| 🇳🇮 Nicaragua | 21.8 | 5.3 | 6.6 | 2.2 | 0.4 |
| 🇳🇪 Niger | 1.0 | 0.1 | 1.8 | 2.8 | 4.4 |
| 🇳🇬 Nigeria | 1.2 | 1.5 | 6.7 | 1.6 | 2.8 |
| 🇰🇵 North Korea | 1.8 | 4.3 | 11.0 | 0.8 | 6.7 |
| 🇲🇰 North Macedonia | 20.0 | 12.6 | 6.2 | 6.8 | 0.9 |
| 🇳🇴 Norway | 20.0 | 23.7 | 50.2 | 17.8 | 5.8 |
| 🇴🇲 Oman | 19.7 | 0.4 | 26.1 | 9.0 | 14.3 |
| 🇵🇰 Pakistan | 6.2 | 0.0 | 1.6 | 9.8 | 2.6 |
| 🇵🇦 Panama | 55.4 | 15.9 | 13.7 | 14.5 | 1.0 |
| 🇵🇬 Papua New Guinea | 3.9 | 9.9 | 14.6 | 0.8 | 47.8 |
| 🇵🇾 Paraguay | 9.6 | 8.8 | 4.0 | 21.9 | 0.6 |
| 🇵🇪 Peru | 42.7 | 4.5 | 27.1 | 4.2 | 1.9 |
| 🇵🇭 Philippines | 15.9 | 14.5 | 29.1 | 3.1 | 0.3 |
| 🇵🇱 Poland | 32.9 | 55.0 | 12.5 | 1.5 | 0.1 |
| 🇵🇹 Portugal | 30.6 | 38.1 | 60.0 | 18.8 | 2.8 |
| 🇶🇦 Qatar | 54.3 | 1.2 | 21.1 | 8.4 | 12.1 |
| 🇷🇴 Romania | 23.9 | 34.5 | 8.3 | 5.2 | 2.7 |
| 🇷🇺 Russia | 30.8 | 28.2 | 21.7 | 12.9 | 5.1 |
| 🇷🇼 Rwanda | 1.5 | 1.0 | 4.6 | 2.7 | 3.2 |
| 🇰🇳 Saint Kitts & Nevis | 48.7 | 15.5 | 38.8 | 2.9 | 2.5 |
| 🇱🇨 Saint Lucia | 57.6 | 14.9 | 33.6 | 3.8 | 2.0 |
| 🇻🇨 Saint Vincent & the Grenadines | 74.7 | 11.3 | 19.4 | 7.8 | 0.7 |
| 🇼🇸 Samoa | 65.7 | 12.3 | 47.6 | 6.9 | 3.5 |
| 🇸🇹 Sao Tome & Principe | 17.1 | 4.7 | 27.7 | 1.7 | 0.1 |
| 🇸🇦 Saudi Arabia | 43.0 | 0.0 | 11.7 | 4.4 | 7.7 |
| 🇸🇳 Senegal | 7.4 | 1.2 | 11.9 | 5.0 | 3.7 |
| 🇷🇸 Serbia | 14.1 | 37.3 | 6.7 | 6.1 | 4.1 |
| 🇸🇨 Seychelles | 36.9 | 13.7 | 56.8 | 9.2 | 2.7 |
| 🇸🇱 Sierra Leone | 5.4 | 1.0 | 25.5 | 1.3 | 1.9 |
| 🇸🇰 Slovakia | 16.9 | 38.8 | 10.2 | 5.8 | 0.9 |
| 🇸🇮 Slovenia | 30.4 | 25.8 | 13.2 | 15.3 | 1.1 |
| 🇸🇧 Solomon Islands | 6.1 | 4.4 | 28.1 | 1.8 | 0.1 |
| 🇿🇦 South Africa | 34.9 | 4.2 | 6.5 | 17.2 | 3.5 |
| 🇰🇷 South Korea | 22.8 | 38.4 | 55.3 | 16.9 | 0.5 |
| 🇸🇸 South Sudan | 4.3 | 0.0 | 2.9 | 12.4 | 4.3 |
| 🇪🇸 Spain | 33.6 | 52.6 | 40.8 | 12.3 | 3.4 |
| 🇱🇰 Sri Lanka | 10.4 | 0.1 | 29.0 | 1.2 | 0.1 |
| 🇸🇩 Sudan | 1.9 | 0.0 | 1.1 | 8.0 | 10.5 |
| 🇸🇷 Suriname | 49.6 | 8.0 | 16.5 | 4.4 | 0.3 |
| 🇸🇪 Sweden | 15.4 | 28.6 | 32.2 | 22.5 | 1.5 |
| 🇨🇭 Switzerland | 16.9 | 27.8 | 16.0 | 19.1 | 2.4 |
| 🇸🇾 Syria | 6.4 | 0.0 | 2.2 | 2.2 | 7.3 |
| 🇹🇼 Taiwan | 41.6 | 38.4 | 29.8 | 6.1 | 0.9 |
| 🇹🇯 Tajikistan | 3.5 | 0.1 | 0.7 | 25.8 | 7.8 |
| 🇹🇿 Tanzania | 1.5 | 0.3 | 6.4 | 7.8 | 1.6 |
| 🇹🇭 Thailand | 11.4 | 13.1 | 29.2 | 1.2 | 0.0 |
| 🇹🇱 Timor-Leste | 9.4 | 11.5 | 6.4 | 1.6 | 0.4 |
| 🇹🇬 Togo | 7.2 | 2.3 | 11.7 | 0.8 | 2.2 |
| 🇹🇹 Trinidad & Tobago | 63.1 | 5.6 | 23.6 | 5.7 | 1.5 |
| 🇹🇳 Tunisia | 17.9 | 0.0 | 14.1 | 3.7 | 5.8 |
| 🇹🇷 Türkiye | 20.0 | 0.0 | 5.5 | 16.0 | 1.3 |
| 🇹🇲 Turkmenistan | 6.1 | 0.1 | 2.8 | 22.5 | 20.8 |
| 🇺🇸 U.S. | 58.7 | 30.6 | 22.8 | 37.9 | 1.4 |
| 🇦🇪 UAE | 31.1 | 0.0 | 25.4 | 6.7 | 10.4 |
| 🇺🇬 Uganda | 1.5 | 2.9 | 14.3 | 3.6 | 1.0 |
| 🇬🇧 UK | 32.7 | 24.0 | 17.9 | 17.4 | 5.0 |
| 🇺🇦 Ukraine | 24.9 | 16.7 | 13.8 | 7.2 | 0.7 |
| 🇺🇾 Uruguay | 21.0 | 14.1 | 9.1 | 19.4 | 3.5 |
| 🇺🇿 Uzbekistan | 3.1 | 0.2 | 4.0 | 31.6 | 6.1 |
| 🇻🇺 Vanuatu | 14.6 | 12.4 | 29.0 | 7.2 | 0.3 |
| 🇻🇪 Venezuela | 16.1 | 4.4 | 10.2 | 12.0 | 0.3 |
| 🇻🇳 Vietnam | 15.8 | 38.2 | 39.6 | 6.1 | 0.5 |
| 🇾🇪 Yemen | 11.2 | 0.0 | 3.0 | 3.0 | 4.5 |
| 🇿🇲 Zambia | 2.6 | 1.5 | 13.1 | 9.3 | 2.7 |
| 🇿🇼 Zimbabwe | 4.6 | 0.7 | 3.0 | 42.3 | 4.3 |
The world’s largest consumers of meat per capita? Hong Kong, Iceland, and Macao have the highest total meat consumption, all above 170 kg (370 lbs) per capita.
We take a brief look through the biggest consumers of each type of meat below.
Who Eats the Most Poultry?
While the U.S. and China eat the most chicken by absolute numbers, the countries rank 7th and 112th respectively when it comes to poultry consumption on a per capita basis.
Several island nations—St. Vincent and the Grenadines, Trinidad & Tobago, Samoa—along with Israel eat more than 60 kilograms of poultry meat (about 15 large birds) per person on an annual basis.
Regionally, poultry consumption can be seen spanning almost all of the Americas, as well as in the UK and former British colonies Australia and South Africa, and in the Middle East.
Who Eats the Most Pork?
Despite eating more seafood and poultry, Hong Kong leads the world in pork consumption per capita annually at 55 kg (121 lbs). This is almost equivalent to the average amount of retail pork harvested from a single 250 lb pig.
Poland and Spain—who are also top pork producers—rank close behind Hong Kong with similar pork consumption numbers. Indeed, we can see pork as the most consumed meat in many European countries with local histories of pork foods, as well as in a few countries in Africa including Burkina Faso and one Southeast Asian country, Timor-Leste.
Who Eats the Most Fish and Seafood?
In the middle of the North Atlantic ocean, Iceland eats the most fish and seafood in the world, at a staggering 90 kg (nearly 200 lbs), per person per year. That also gives Iceland the crown for the highest per-capita consumption of any single type of meat.
Behind Iceland are other island and high coastline nations, including the Maldives, Hong Kong, Macao, and Portugal. Regionally we can see the importance of seafood reflected in East and South Asia, the Atlantic coastline of Africa, and the Nordic countries in Europe.
Who Eats the Most Beef?
Argentina’s 46-million-strong population eats nearly 47 kg (103 lbs) of bovine meat per person per year, the most by any country in the UN’s database.
The South American country has a rich culinary history with beef, as cattle brought by Spanish settlers flourished on the grassy plains of the region. Such is cattle’s importance on the continent that the gaucho—a horseman engaged in cattle work—is a folk symbol in Argentina, Uruguay and parts of Brazil (which ranks 5th in beef consumption).
The map of beef consumption highlights Central Asian countries including Uzbekistan and Eastern African countries including Ethiopia.
Who Eats the Most Mutton & Other Meat?
The people of Mongolia are unrivaled in their consumption of mutton and goat meat, devouring an impressive 66 kilograms (145 pounds) per capita annually. This voracious appetite for meat is deeply rooted in their heritage as a nation of skilled shepherds.
Papua New Guinea, meanwhile, tops the “other meat” consumption rankings. The country is the largest producer of game meat in the world, due to its mostly rural and indigenous population relying on hunting. One 2023 study found that a sample of villages in the country primarily hunted wild deer and boar for meat, although marsupials like bandicoots, tree-kangaroos, and cuscus were occasionally hunted and consumed as well.
Mongolia also ranks highly in consumption of other meat per capita, likely due to their traditional consumption of horse meat. The country produced just over 100,000 tons of horse meat in 2020, one-sixth of the country’s total meat production that year.
Mapping Meat Consumption By Country, Without Seafood
What happens to each country’s meat consumption habits if we remove fish and seafood from the dataset? The map, and the rankings change quite a bit.
Most of the blue on the map is replaced with a wash of yellow, indicating the global popularity of poultry meat as a cheap and efficient source of protein. However, much of East Asia including China and European countries like France and Sweden consume more pork.
The rankings for total meat consumption also shuffle.
| Country | Total (With Seafood) | Total (Without Seafood) |
|---|---|---|
| 🇦🇫 Afghanistan | 9.6 | 9.3 |
| 🇦🇱 Albania | 47.8 | 39.1 |
| 🇩🇿 Algeria | 22.4 | 18.6 |
| 🇦🇴 Angola | 34.1 | 19.9 |
| 🇦🇬 Antigua & Barbuda | 136.2 | 82.1 |
| 🇦🇷 Argentina | 116.9 | 110.2 |
| 🇦🇲 Armenia | 56.4 | 50.9 |
| 🇦🇺 Australia | 145.6 | 121.5 |
| 🇦🇹 Austria | 91.2 | 76.9 |
| 🇦🇿 Azerbaijan | 38.9 | 36.9 |
| 🇧🇸 Bahamas | 109.3 | 85.1 |
| 🇧🇭 Bahrain | 96.9 | 80.6 |
| 🇧🇩 Bangladesh | 31.1 | 4.3 |
| 🇧🇧 Barbados | 115.8 | 73.0 |
| 🇧🇾 Belarus | 102.2 | 90.4 |
| 🇧🇪 Belgium | 84.5 | 61.9 |
| 🇧🇿 Belize | 61.8 | 48.5 |
| 🇧🇯 Benin | 30.8 | 14.6 |
| 🇧🇹 Bhutan | 23.4 | 16.1 |
| 🇧🇴 Bolivia | 79.9 | 77.1 |
| 🇧🇦 Bosnia & Herzegovina | 50.1 | 42.8 |
| 🇧🇼 Botswana | 31.1 | 28.6 |
| 🇧🇷 Brazil | 107.2 | 99.2 |
| 🇧🇬 Bulgaria | 64.3 | 56.9 |
| 🇧🇫 Burkina Faso | 43.2 | 34.3 |
| 🇧🇮 Burundi | 5.7 | 3.1 |
| 🇨🇻 Cabo Verde | 41.2 | 30.4 |
| 🇰🇭 Cambodia | 58.6 | 12.9 |
| 🇨🇲 Cameroon | 30.8 | 11.6 |
| 🇨🇦 Canada | 111.3 | 90.6 |
| 🇨🇫 Central African Republic | 45.1 | 37.8 |
| 🇹🇩 Chad | 53.5 | 46.9 |
| 🇨🇱 Chile | 97.8 | 83.0 |
| 🇨🇳 China | 102.0 | 62.1 |
| 🇨🇴 Colombia | 67.0 | 58.1 |
| 🇰🇲 Comoros | 45.5 | 31.2 |
| 🇨🇬 Congo | 64.5 | 40.0 |
| 🇨🇷 Costa Rica | 76.4 | 58.5 |
| 🇨🇮 Côte d’Ivoire | 35.0 | 11.8 |
| 🇭🇷 Croatia | 98.6 | 79.5 |
| 🇨🇺 Cuba | 77.6 | 71.6 |
| 🇨🇾 Cyprus | 101.1 | 75.6 |
| 🇨🇿 Czechia | 89.6 | 79.2 |
| 🇩🇰 Denmark | 90.1 | 63.7 |
| 🇩🇯 Djibouti | 18.9 | 15.4 |
| 🇩🇲 Dominica | 87.9 | 60.1 |
| 🇩🇴 Dominican Republic | 57.1 | 48.6 |
| 🇨🇩 DR Congo | 7.4 | 3.3 |
| 🇪🇨 Ecuador | 53.6 | 45.4 |
| 🇪🇬 Egypt | 50.3 | 23.3 |
| 🇸🇻 El Salvador | 45.4 | 38.8 |
| 🇪🇪 Estonia | 82.4 | 67.8 |
| 🇸🇿 Eswatini | 31.7 | 27.4 |
| 🇪🇹 Ethiopia | 8.4 | 7.9 |
| 🇫🇯 Fiji | 67.4 | 40.9 |
| 🇫🇮 Finland | 104.8 | 71.4 |
| 🇫🇷 France | 111.5 | 78.2 |
| 🇵🇫 French Polynesia | 135.4 | 88.2 |
| 🇬🇦 Gabon | 95.7 | 67.0 |
| 🇬🇲 Gambia | 40.6 | 15.5 |
| 🇬🇪 Georgia | 45.1 | 35.1 |
| 🇩🇪 Germany | 91.4 | 78.8 |
| 🇬🇭 Ghana | 43.5 | 18.5 |
| 🇬🇷 Greece | 96.2 | 74.5 |
| 🇬🇩 Grenada | 91.3 | 57.5 |
| 🇬🇹 Guatemala | 47.2 | 44.2 |
| 🇬🇳 Guinea | 23.6 | 13.9 |
| 🇬🇼 Guinea-Bissau | 16.5 | 15.3 |
| 🇬🇾 Guyana | 76.8 | 51.8 |
| 🇭🇹 Haiti | 25.0 | 20.0 |
| 🇭🇳 Honduras | 35.4 | 32.8 |
| 🇭🇰 Hong Kong | 202.1 | 136.3 |
| 🇭🇺 Hungary | 89.3 | 82.9 |
| 🇮🇸 Iceland | 180.9 | 90.2 |
| 🇮🇳 India | 12.6 | 4.6 |
| 🇮🇩 Indonesia | 62.3 | 17.9 |
| 🇮🇷 Iran | 50.6 | 38.0 |
| 🇮🇶 Iraq | 13.8 | 10.2 |
| 🇮🇪 Ireland | 101.8 | 79.2 |
| 🇮🇱 Israel | 124.1 | 99.4 |
| 🇮🇹 Italy | 99.4 | 70.2 |
| 🇯🇲 Jamaica | 86.7 | 61.5 |
| 🇯🇵 Japan | 99.6 | 53.4 |
| 🇯🇴 Jordan | 42.8 | 37.7 |
| 🇰🇿 Kazakhstan | 74.7 | 71.9 |
| 🇰🇪 Kenya | 13.6 | 10.7 |
| 🇰🇮 Kiribati | 112.4 | 39.2 |
| 🇰🇼 Kuwait | 86.6 | 72.7 |
| 🇰🇬 Kyrgyzstan | 33.2 | 32.1 |
| 🇱🇦 Laos | 53.1 | 29.0 |
| 🇱🇻 Latvia | 95.8 | 70.8 |
| 🇱🇧 Lebanon | 38.2 | 29.5 |
| 🇱🇸 Lesotho | 14.7 | 11.7 |
| 🇱🇷 Liberia | 23.4 | 19.1 |
| 🇱🇾 Libya | 56.5 | 42.2 |
| 🇱🇹 Lithuania | 123.9 | 90.9 |
| 🇱🇺 Luxembourg | 110.6 | 78.9 |
| 🇲🇴 Macao | 176.9 | 103.7 |
| 🇲🇬 Madagascar | 9.8 | 5.8 |
| 🇲🇼 Malawi | 33.7 | 23.6 |
| 🇲🇾 Malaysia | 119.4 | 64.7 |
| 🇲🇻 Maldives | 101.2 | 18.1 |
| 🇲🇱 Mali | 17.1 | 8.6 |
| 🇲🇹 Malta | 102.0 | 79.1 |
| 🇲🇷 Mauritania | 39.5 | 31.1 |
| 🇲🇺 Mauritius | 74.5 | 50.5 |
| 🇲🇽 Mexico | 84.7 | 71.1 |
| 🇫🇲 Micronesia | 106.7 | 59.4 |
| 🇲🇩 Moldova | 50.3 | 38.6 |
| 🇲🇳 Mongolia | 112.1 | 111.6 |
| 🇲🇪 Montenegro | 93.0 | 77.4 |
| 🇲🇦 Morocco | 57.0 | 38.6 |
| 🇲🇿 Mozambique | 21.0 | 7.6 |
| 🇲🇲 Myanmar | 106.0 | 61.0 |
| 🇳🇦 Namibia | 44.3 | 32.4 |
| 🇳🇷 Nauru | 156.2 | 105.1 |
| 🇳🇵 Nepal | 17.7 | 14.2 |
| 🇳🇱 Netherlands | 81.0 | 59.1 |
| 🇳🇨 New Caledonia | 101.7 | 78.3 |
| 🇳🇿 New Zealand | 111.4 | 85.0 |
| 🇳🇮 Nicaragua | 36.3 | 29.6 |
| 🇳🇪 Niger | 10.1 | 8.3 |
| 🇳🇬 Nigeria | 13.8 | 7.0 |
| 🇰🇵 North Korea | 24.6 | 13.6 |
| 🇲🇰 North Macedonia | 46.6 | 40.3 |
| 🇳🇴 Norway | 117.4 | 67.2 |
| 🇴🇲 Oman | 69.5 | 43.4 |
| 🇵🇰 Pakistan | 20.2 | 18.6 |
| 🇵🇦 Panama | 100.5 | 86.8 |
| 🇵🇬 Papua New Guinea | 77.0 | 62.4 |
| 🇵🇾 Paraguay | 44.9 | 40.9 |
| 🇵🇪 Peru | 80.5 | 53.4 |
| 🇵🇭 Philippines | 62.8 | 33.7 |
| 🇵🇱 Poland | 102.0 | 89.5 |
| 🇵🇹 Portugal | 150.2 | 90.2 |
| 🇶🇦 Qatar | 96.9 | 75.9 |
| 🇷🇴 Romania | 74.7 | 66.4 |
| 🇷🇺 Russia | 98.6 | 76.9 |
| 🇷🇼 Rwanda | 12.9 | 8.4 |
| 🇰🇳 Saint Kitts & Nevis | 108.5 | 69.7 |
| 🇱🇨 Saint Lucia | 111.9 | 78.3 |
| 🇻🇨 Saint Vincent & the Grenadines | 113.8 | 94.4 |
| 🇼🇸 Samoa | 135.9 | 88.3 |
| 🇸🇹 Sao Tome & Principe | 51.3 | 23.6 |
| 🇸🇦 Saudi Arabia | 66.8 | 55.0 |
| 🇸🇳 Senegal | 29.1 | 17.2 |
| 🇷🇸 Serbia | 68.3 | 61.6 |
| 🇸🇨 Seychelles | 119.2 | 62.5 |
| 🇸🇱 Sierra Leone | 35.0 | 9.5 |
| 🇸🇰 Slovakia | 72.7 | 62.5 |
| 🇸🇮 Slovenia | 85.7 | 72.5 |
| 🇸🇧 Solomon Islands | 40.5 | 12.4 |
| 🇿🇦 South Africa | 66.2 | 59.8 |
| 🇰🇷 South Korea | 133.8 | 78.5 |
| 🇸🇸 South Sudan | 23.9 | 21.0 |
| 🇪🇸 Spain | 142.7 | 101.9 |
| 🇱🇰 Sri Lanka | 40.8 | 11.8 |
| 🇸🇩 Sudan | 21.5 | 20.3 |
| 🇸🇷 Suriname | 78.8 | 62.3 |
| 🇸🇪 Sweden | 100.2 | 68.0 |
| 🇨🇭 Switzerland | 82.2 | 66.2 |
| 🇸🇾 Syria | 18.0 | 15.8 |
| 🇹🇼 Taiwan | 116.7 | 87.0 |
| 🇹🇯 Tajikistan | 37.9 | 37.2 |
| 🇹🇿 Tanzania | 17.6 | 11.2 |
| 🇹🇭 Thailand | 54.9 | 25.8 |
| 🇹🇱 Timor-Leste | 29.3 | 22.9 |
| 🇹🇬 Togo | 24.2 | 12.5 |
| 🇹🇹 Trinidad & Tobago | 99.5 | 75.9 |
| 🇹🇳 Tunisia | 41.4 | 27.3 |
| 🇹🇷 Türkiye | 42.8 | 37.3 |
| 🇹🇲 Turkmenistan | 52.2 | 49.4 |
| 🇺🇸 U.S. | 151.4 | 128.6 |
| 🇦🇪 UAE | 73.6 | 48.2 |
| 🇺🇬 Uganda | 23.3 | 9.0 |
| 🇬🇧 UK | 97.0 | 79.1 |
| 🇺🇦 Ukraine | 63.3 | 49.5 |
| 🇺🇾 Uruguay | 67.3 | 58.1 |
| 🇺🇿 Uzbekistan | 45.0 | 41.0 |
| 🇻🇺 Vanuatu | 63.5 | 34.5 |
| 🇻🇪 Venezuela | 43.1 | 32.9 |
| 🇻🇳 Vietnam | 100.2 | 60.6 |
| 🇾🇪 Yemen | 21.7 | 18.7 |
| 🇿🇲 Zambia | 29.3 | 16.2 |
| 🇿🇼 Zimbabwe | 54.9 | 51.9 |
Hong Kong remains at the top, but the U.S. jumps up three spots to second place, with annual per capita meat consumption at 128 kg (282 lbs) when seafood isn’t included.
Iceland and Macao drop to the top 15, while Australia, Mongolia, and Argentina climb into the top five. Other countries that preferred seafood dropped a lot lower, such as Japan, which fell 40 spots in the total consumption rankings when fish was removed.
-

 Energy3 weeks ago
How Big is the Market for Crude Oil?
-

 Crime7 days ago
Mapped: The Safest Cities in the U.S.
-

 Markets2 weeks ago
Ranked: The Most Profitable U.S. Companies, by Sector
-

 Technology5 days ago
How Long it Took for Popular Apps to Reach 100 Million Users
-

 Markets4 weeks ago
The World’s Biggest Mutual Fund and ETF Providers
-

 Brands2 weeks ago
Brand Reputations: Ranking the Best and Worst in 2023
-

 Environment5 days ago
Hotter Than Ever: 2023 Sets New Global Temperature Records
-

 Datastream4 weeks ago
Can You Calculate Your Daily Carbon Footprint?