Money
Animated: Change in Russian Billionaires’ Wealth Since 2022
Article/Editing:
Animated: Change in Russian Billionaires’ Wealth Since 2022
When Russia invaded Ukraine in February 2022, many countries retaliated with sanctions targeting Russian billionaires—the oligarchs—and politicians directly.
And as the war has progressed, those sanctions have intensified, with even the relatives and shell companies of these billionaires being targeted over time. The reason? These oligarchs are interconnected to Russia’s government, lending vocal and fiscal support in exchange for sweetheart deals or beneficial government oversight.
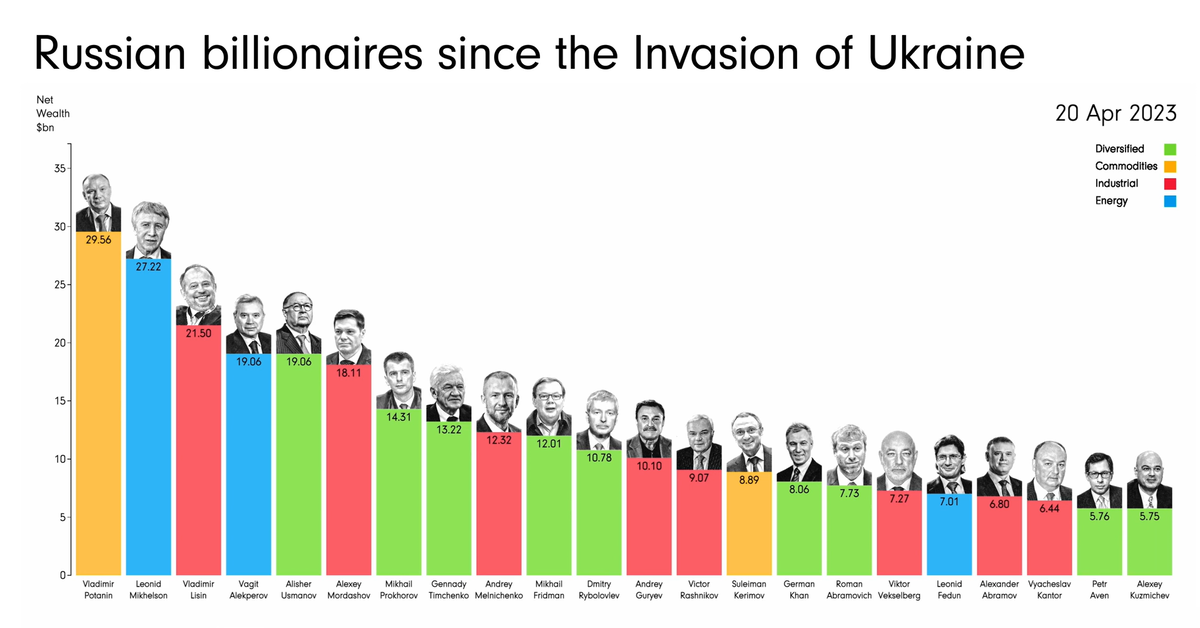
This animation from James Eagle shows how the estimated net wealth of the 22 wealthiest Russian billionaires on the Bloomberg Billionaires Index in April 2023 has changed since January 2022, prior to the start of the conflict.
Net Wealth of Top Russian Billionaires
The 22 wealthiest Russian billionaires in April 20, 2023 lost a collective $90.4 billion in net worth since January 5, 2022.
| Rank | Name | Main Industry | Net Wealth (Apr 20, 2023) | Net Wealth (Jan 5, 2022) | % Change |
|---|---|---|---|---|---|
| 1 | Vladimir Potanin | Commodities | $29.6B | $31.1B | -4.8% |
| 2 | Leonid Mikhelson | Energy | $27.2B | $33.2B | -18.1% |
| 3 | Vladimir Lisin | Industrial | $21.5B | $28.0B | -23.2% |
| 4 | Vagit Alekperov | Energy | $19.1B | $22.8B | -16.2% |
| 5 | Alisher Usmanov | Diversified | $19.1B | $21.2B | -9.9% |
| 6 | Alexey Mordashov | Industrial | $18.1B | $29.1B | -37.8% |
| 7 | Mikhail Prokhorov | Diversified | $14.3B | $14.0B | 2.1% |
| 8 | Gennady Timchenko | Diversified | $13.2B | $23.1B | -42.9% |
| 9 | Andrey Melnichenko | Industrial | $12.3B | $17.8B | -30.9% |
| 10 | Mikhail Fridman | Diversified | $12.0B | $14.1B | -14.9% |
| 11 | Dmitry Rybolovlev | Diversified | $10.8B | $11.2B | -3.6% |
| 12 | Andrey Guryev | Industrial | $10.1B | $8.0B | 26.3% |
| 13 | Victor Rashnikov | Industrial | $9.1B | $14.4B | -36.8% |
| 14 | Suleiman Kerimov | Commodities | $8.9B | $15.2B | -41.4% |
| 15 | German Khan | Diversified | $8.1B | $9.6B | -15.6% |
| 16 | Roman Abramovich | Diversified | $7.7B | $18.2B | -57.7% |
| 17 | Viktor Vekselberg | Industrial | $7.3B | $18.6B | -60.8% |
| 18 | Leonid Fedun | Energy | $7.0B | $8.9B | -21.3% |
| 19 | Alexander Abramov | Industrial | $6.8B | $9.1B | -25.3% |
| 20 | Vyacheslav Kantor | Industrial | $6.4B | $9.1B | -29.7% |
| 21 | Petr Aven | Diversified | $5.8B | $6.6B | -12.1% |
| 22 | Alexey Kuzmichev | Diversified | $5.8B | $7.3B | -20.5% |
The heaviest hit include Viktor Vekselberg, who holds a stake in UC Rusal, the world’s third largest aluminum producer. Since the start of the war, he’s lost an estimated $11.3 billion or 61% of his net worth from January 2022.
Roman Abramovich, who got his start in the early oligarchy through oil conglomerates, was also hit hard by the sanctions. He lost $10.5 billion or 58% of his net worth from January 2022, and was forced to sell Chelsea Football Club in one of the biggest sports team sales in history.
Notably, the richest oligarchs haven’t lost as much. Mining giant Norilsk Nickel’s largest shareholder, Vladimir Potanin, saw his net worth only drop by 4.8%. After being hit hard at the onset of the war in Ukraine, he quickly rebounded and at many times had an even higher net worth, reaching $35.6 billion in June 2022.
And a few oligarchs, like former Norilsk Nickel CEO Mikhail Prokhorov and phosphate-based fertilizer baron Andrey Guryev, saw their wealth increase since January 2022. Guryev grew his net worth by $2 billion or 26%, while Prokhorov (who formerly owned the NBA’s Brooklyn Nets) saw his net worth even out at a gain of $0.3 billion or 2%.
Oligarch Support of Russia (or Lack Thereof)
As Russia’s war with Ukraine has dragged on, and sanctions have continued to weigh on Russian billionaires, politicians, and companies, their effects have been uncertain.
Oligarchs have lost net worth, relinquished foreign businesses, and even had prized possessions like mansions and yachts seized. At the same time, though Russia’s economy has weakened under sanctions, bolstered trade with countries like China, India, and Saudi Arabia have kept it stronger than expected.
And though some oligarchs have voiced various concerns over the ongoing war, the wealthiest have been careful to toe the line. Russian billionaires and politicians that did vocalize criticism, including Lukoil chairman Ravil Maganov, have been found dead in apparent suicides, heart attacks, and accidents.
The most serious oligarch rebellion wasn’t due to economic hardships, but military operations. Oligarch and mercenary leader Yevgeny Prigozhin launched an attempted coup in June 2023, reportedly retreating after support from within Russia’s military quickly fizzled.

This article was published as a part of Visual Capitalist's Creator Program, which features data-driven visuals from some of our favorite Creators around the world.


Money
Ranked: The Most Affordable U.S. Cities for Home Buyers
There’s more to consider than the price tag when purchasing a house. This ranking reveals the most affordable U.S. cities for home buyers.

Ranked: The Most Affordable U.S. Cities for Home Buyers
Just before the pandemic, the average home price in the U.S. was $313,000—a figure that has since jumped by 40% to $436,800 today. As home prices and mortgage rates increase, home ownership is becoming an unrealistic dream for some.
In the cities ranked above, however, buying a house is a much more attainable goal.
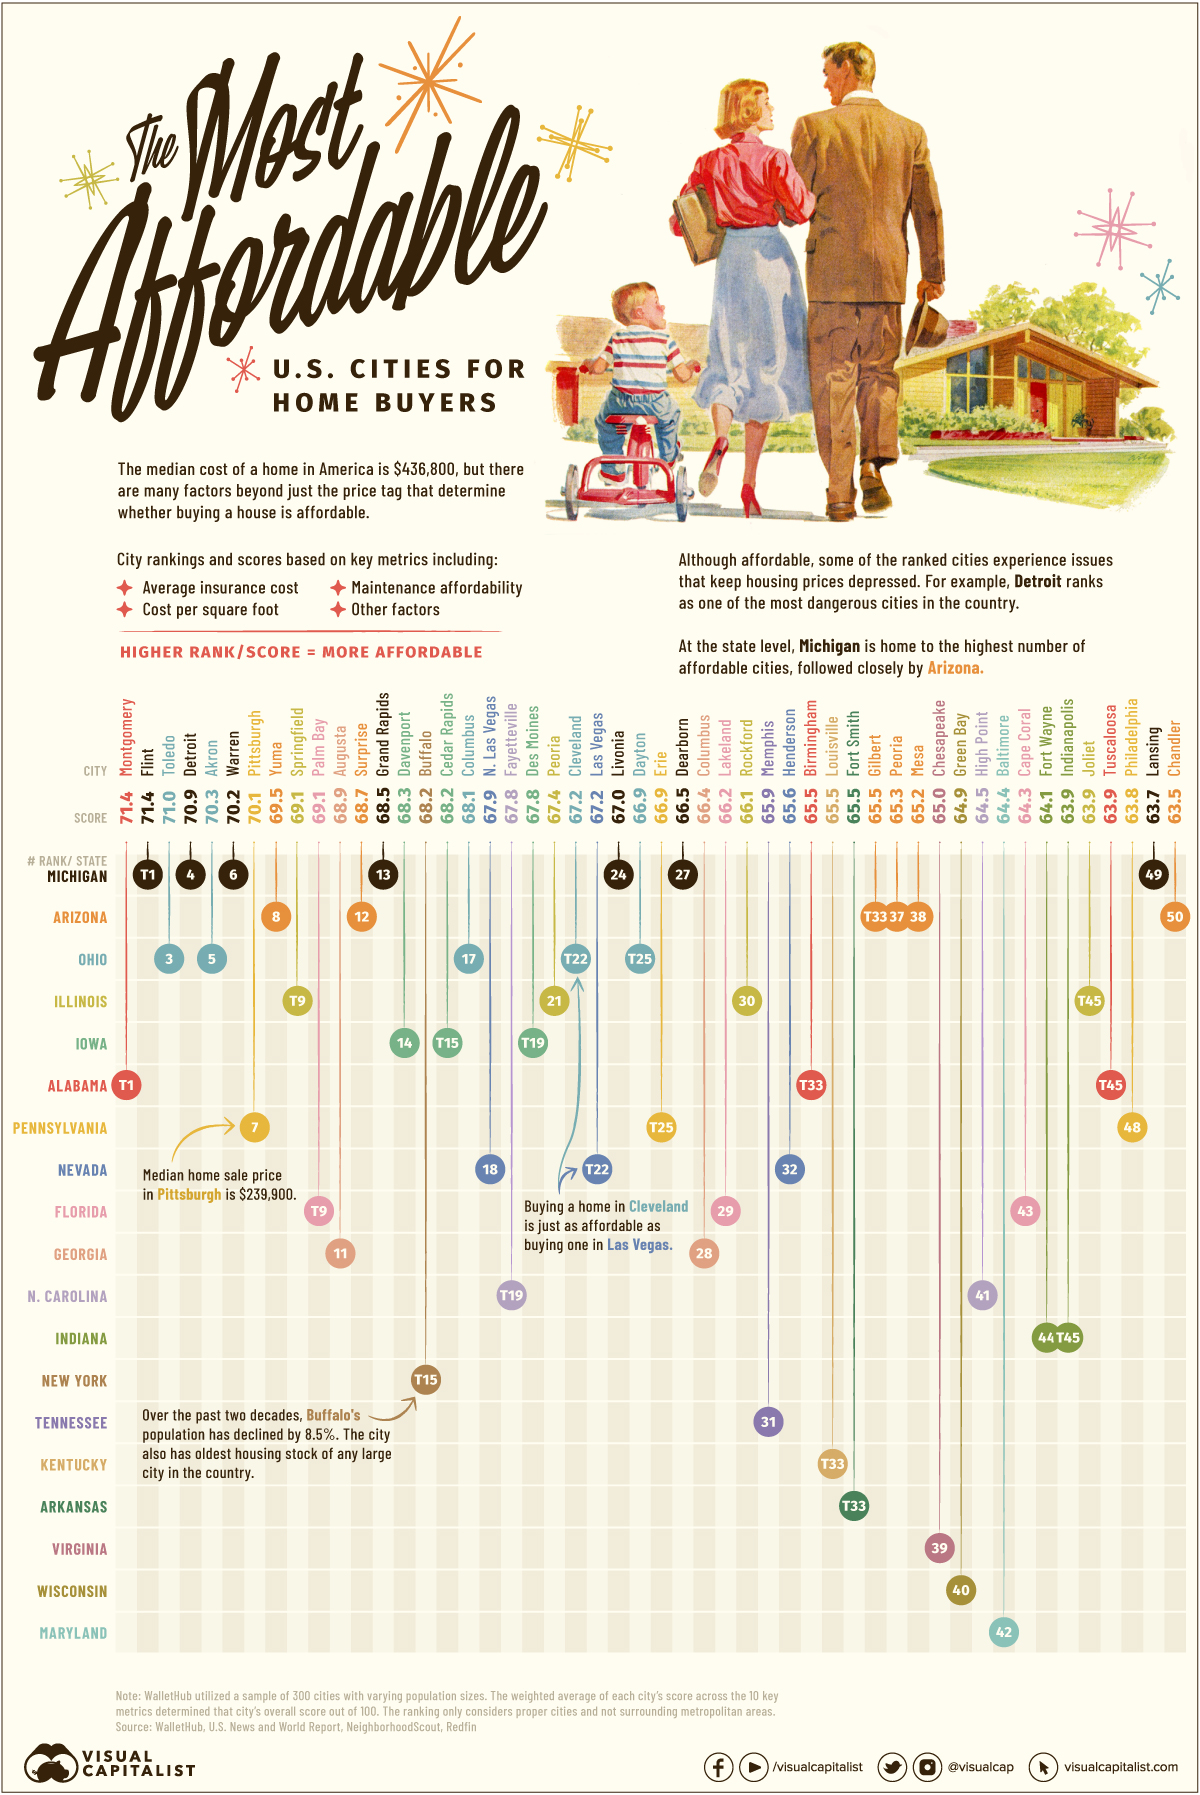
By looking at factors like the real estate tax rate, median home price appreciation, and cost of living, this study from WalletHub assesses the most affordable cities in the U.S. for home buyers. The scores in the ranking are out of 100 and the higher a score, the more affordable that city is for home buyers.
The Methodology
This ranking considers much more than just the price tag on a house when it comes to affordability. Using 10 metrics, which cover an array of important considerations for home buyers, the overall affordability score is measured for each city.
Here’s a closer look at the 10 categories and how each one was weighted and measured:
| Metric | Weight |
|---|---|
| Housing Affordability | 25.00 points |
| Cost per Square Foot | 16.67 points |
| Maintenance Affordability | 8.33 points |
| Average Cost of Homeowner's Insurance | 8.33 points |
| Cost of Living | 8.33 points |
| Real Estate Tax Rate | 8.33 points |
| Rent-to-Price-Ratio | 8.33 points |
| Median Home Price Appreciation | 8.33 points |
| Quarterly Active Listings per Capita | 4.17 points |
| Vacancy Rate | 4.17 points |
The highest-weighted metric is the median price of the home itself divided by the median household income in that area, or house affordability.
Other important metrics assessed include the availability of homes for sale, the average cost of homeowner’s insurance, maintenance costs, and many other vital things people must consider when purchasing a home.
Which U.S. Cities are the Most Affordable for Home Buyers?
Here’s a closer look at the 50 most affordable cities for home buyers in the U.S.:
| Rank | City | Score |
|---|---|---|
| T1 | Montgomery, AL | 71.4 |
| T1 | Flint, MI | 71.4 |
| 3 | Toledo, OH | 71.0 |
| 4 | Detroit, MI | 70.9 |
| 5 | Akron, OH | 70.3 |
| 6 | Warren, MI | 70.2 |
| 7 | Pittsburgh, PA | 70.1 |
| 8 | Yuma, AZ | 69.5 |
| T9 | Springfield, Il | 69.1 |
| T9 | Palm Bay, FL | 69.1 |
| 11 | Augusta, GA | 68.9 |
| 12 | Surpise, AZ | 68.7 |
| 13 | Grand Rapids, MI | 68.5 |
| 14 | Davenport, IA | 68.3 |
| T15 | Buffalo, NY | 68.2 |
| T15 | Cedar Rapids, IA | 68.2 |
| 17 | Columbus, OH | 68.1 |
| 18 | North Las Vegas, NV | 67.9 |
| T19 | Fayetteville, NC | 67.8 |
| T19 | Des Moines, IA | 67.8 |
| 21 | Peoria, IL | 67.4 |
| T22 | Cleveland, OH | 67.2 |
| T22 | Las Vegas, NV | 67.2 |
| 24 | Livonia, MI | 67.0 |
| T25 | Dayton, OH | 66.9 |
| T25 | Erie, PA | 66.9 |
| 27 | Dearborn, MI | 66.5 |
| 28 | Columbus, GA | 66.4 |
| 29 | Lakeland, FL | 66.2 |
| 30 | Rockford, IL | 66.1 |
| 31 | Memphis, TN | 65.9 |
| 32 | Henderson, NV | 65.6 |
| T33 | Birmingham, AL | 65.5 |
| T33 | Louisville, KY | 65.5 |
| T33 | Fort Smith, AR | 65.5 |
| T33 | Gilbert, AZ | 65.5 |
| 37 | Peoria, AZ | 65.3 |
| 38 | Mesa, AZ | 65.2 |
| 39 | Chesapeake, VA | 65.0 |
| 40 | Green Bay, WI | 64.9 |
| 41 | High Point, NC | 64.5 |
| 42 | Baltimore, MD | 64.4 |
| 43 | Cape Coral, FL | 64.3 |
| 44 | Fort Wayne, IN | 64.1 |
| T45 | Indianapolis, IN | 63.9 |
| T45 | Joliet, IL | 63.9 |
| T45 | Tuscaloosa, AL | 63.9 |
| 48 | Philadelphia, PA | 63.8 |
| 49 | Lansing, MI | 63.7 |
| 50 | Chandler, AZ | 63.5 |
When it comes to the individual metrics, here’s a look at some cities which had the best scores in a few of the unique categories:
- #1 in Housing Affordability: Springfield, IL
- #1 in Maintenance Affordability: Sunnyvale, CA
- #1 in Rent-to-Price Ratio: Flint, MI
- #1 in Vacancy Rate: Miami Beach, FL
Location, Location, Location
Narrowing down which locations are feasible from a lifestyle and financial standpoint is a critical first step in the home-buying journey. Popular suburban communities and iconic hubs like Los Angeles or NYC hold great appeal, but these places command a higher price point or have housing stock that is incompatible with lifestyle needs.
On the flip side, some of the most affordable cities may have issues that negatively affect desirability. Flint, Michigan (#1), for example, is still widely perceived to have issues with its drinking water. Other places are high in crime or have a narrow range of economic opportunities, like Detroit (#4) or Yuma, Arizona (#9), respectively.
Many of the cities in the ranking are concentrated in Michigan, Arizona, and Ohio. In terms of big cities that are actually affordable, Pittsburgh, Columbus, Philadelphia, and Baltimore are examples of well-known spots to make the list.
There are also a number of ties in the ranking, with makes for interesting juxtapositions. For instance, Las Vegas is just as affordable as Cleveland, Ohio (#22). Here’s a look at some other cities that are equally affordable for home buyers:
- Montgomery, Alabama and Flint, Michigan (#1)
- Springfield, Illinois and Palm Bay, Florida (#9)
- Buffalo, New York and Cedar Rapids, Iowa (#15)
- Fayetteville, North Carolina and Des Moines, Iowa (#19)
- Dayton, Ohio and Erie, Pennsylvania (#25)
- Birmingham, Alabama; Louisville, Kentucky; Fort Smith, Arkansas; and Gilbert, Arizona (#33)
- Indianapolis, Indiana; Joliet, Illinois; and Tuscaloosa, Alabama (#45)
Overall, the home ownership rate in the U.S.—the share of homes that are occupied by their owners—is currently 66%, according to FRED data. While the trend shows a general recovery from the steep drop off that occurred during the pandemic, there is a while to go before the U.S. reaches pre-2020 figures. Perhaps, these affordable towns could offer a solution.
Where Does This Data Come From?
Source: WalletHub using data from the U.S. Census Bureau, The National Association of Realtors, Council for Community and Economic Research and Insurance Information Institute.
Data notes: To determine the most affordable cities for home buyers, WalletHub compared a sample of 300 U.S. cities (varying in size) across ten key metrics, which are listed below with their corresponding weights. Each metric was graded on a 100-point scale, with a score of 100 representing the most favorable conditions for home affordability. The ranking only considers proper cities and not surrounding metropolitan areas. Visit the source for further details.
-

 Energy3 weeks ago
How Old Are the World’s Nuclear Reactors?
-

 Countries7 days ago
Mapped: World’s Top 40 Largest Military Budgets
-

 Energy3 weeks ago
How Big is the Market for Crude Oil?
-

 United States6 days ago
Mapped: The Safest Cities in the U.S.
-

 Markets2 weeks ago
Ranked: The Most Profitable U.S. Companies, by Sector
-

 Technology5 days ago
How Long it Took for Popular Apps to Reach 100 Million Users
-

 Markets4 weeks ago
The World’s Biggest Mutual Fund and ETF Providers
-

 Brands2 weeks ago
Brand Reputations: Ranking the Best and Worst in 2023