Automotive
The Most Fuel Efficient Cars From 1975 to Today


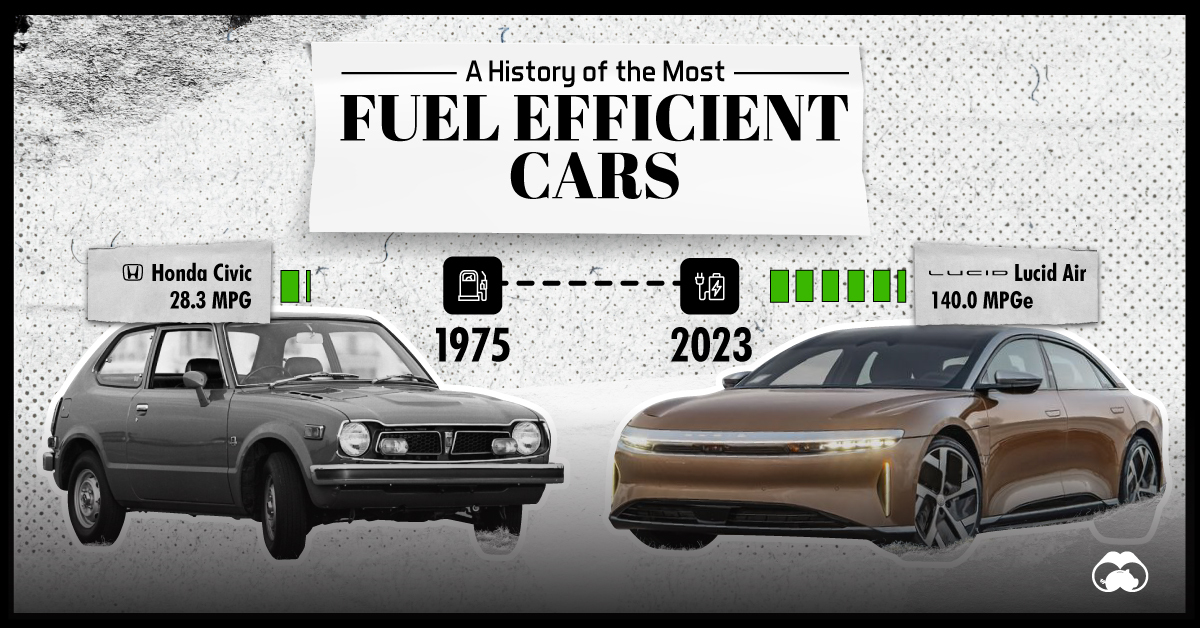
The Most Fuel Efficient Cars From 1975 to Today
When shopping for a new car, what is the most important factor you look for? According to Statista, it’s not design, quality, or even safety—it’s fuel efficiency.
Because of this, automakers are always looking for clever ways to improve gas mileage in their cars. Beating the competition by even the slimmest of margins can give valuable bragging rights within a segment.
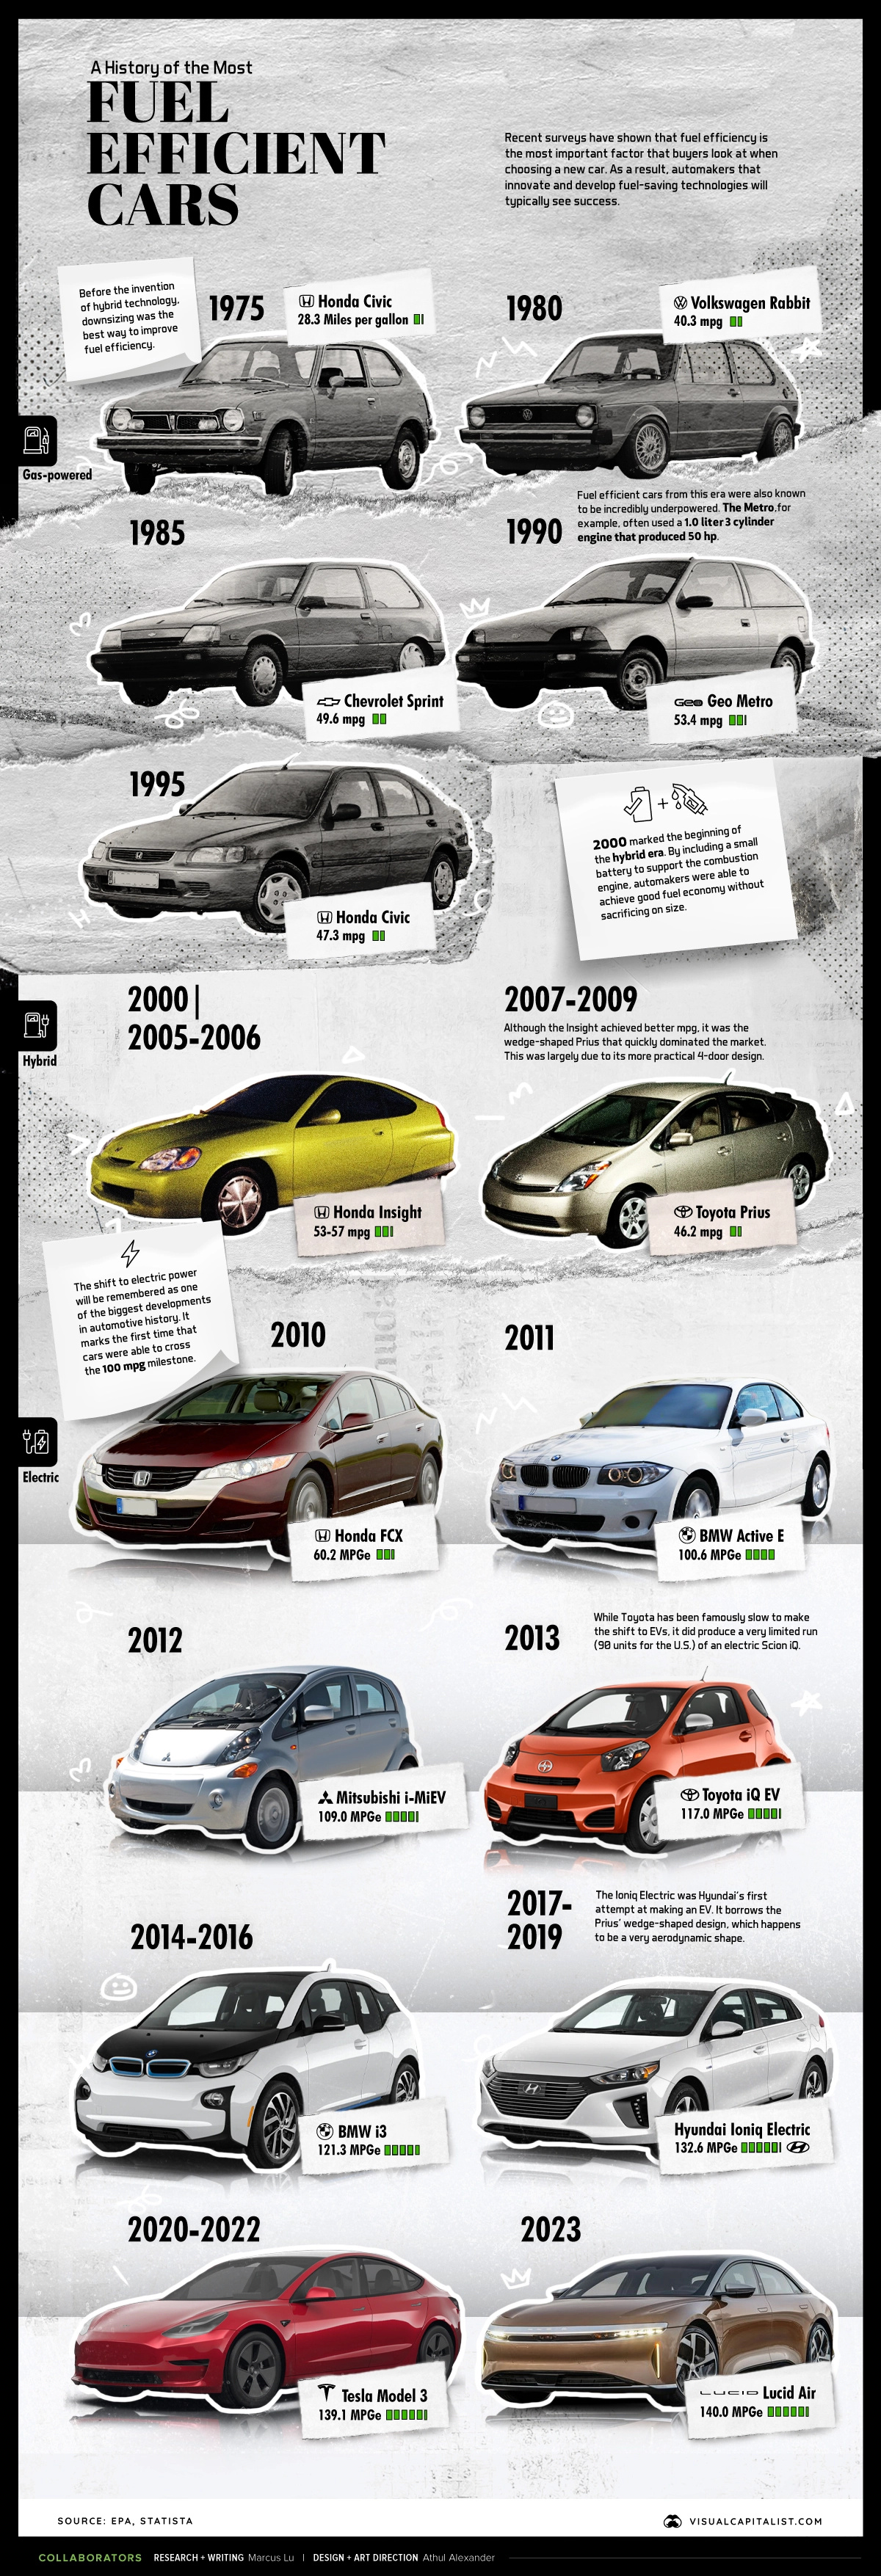
In this infographic, we’ve used data from the EPA’s 2022 Automotive Trends Report to list off the most fuel efficient cars from 1975 to today.
Editor’s note: This is from a U.S. government agency, so the data shown skews towards cars sold in North America.
Data Overview
All of the information in the above infographic is listed in the table below. Data was only available in 5-year increments up until 2005, after which it switches to annual.
| Model Year | Make | Model | Real World Fuel Economy (mpg) | Engine Type |
|---|---|---|---|---|
| 1975 | Honda | Civic | 28.3 | Gas |
| 1980 | VW | Rabbit | 40.3 | Diesel |
| 1985 | Chevrolet | Sprint | 49.6 | Gas |
| 1990 | Geo | Metro | 53.4 | Gas |
| 1995 | Honda | Civic | 47.3 | Gas |
| 2000 | Honda | Insight | 57.4 | Hybrid |
| 2005 | Honda | Insight | 53.3 | Hybrid |
| 2006 | Honda | Insight | 53 | Hybrid |
| 2007 | Toyota | Prius | 46.2 | Hybrid |
| 2008 | Toyota | Prius | 46.2 | Hybrid |
| 2009 | Toyota | Prius | 46.2 | Hybrid |
| 2010 | Honda | FCX | 60.2 | FCEV |
| 2011 | BMW | Active E | 100.6 | EV |
| 2012 | Mitsubishi | i-MiEV | 109 | EV |
| 2013 | Toyota | iQ EV | 117 | EV |
| 2014 | BMW | i3 | 121.3 | EV |
| 2015 | BMW | i3 | 121.3 | EV |
| 2016 | BMW | i3 | 121.3 | EV |
| 2017 | Hyundai | Ioniq Electric | 132.6 | EV |
| 2018 | Hyundai | Ioniq Electric | 132.6 | EV |
| 2019 | Hyundai | Ioniq Electric | 132.6 | EV |
| 2020 | Tesla | 3 | 138.6 | EV |
| 2021 | Tesla | 3 | 139.1 | EV |
From this dataset, we can identify three distinct approaches to maximizing fuel efficiency.
Downsizing
Prior to 2000, the best way for automakers to achieve good fuel efficiency was by downsizing. Making cars smaller (lighter) meant they could also be fitted with very small engines.
For example, the 1985 Chevrolet Sprint was rated at 49.6 MPG, but had a sluggish 0-60 time of 15 seconds.
Hybrids
The 2000s saw the introduction of mass-market hybrid vehicles like the Honda Insight and Toyota Prius. By including a small battery to support the combustion engine, automakers could achieve good MPGs without sacrificing so heavily on size.
While the Insight achieved better fuel economy than the Prius, it was the latter that became synonymous with the term “hybrid”. This was largely due to the Prius’ more practical 4-door design.
The following table compares annual U.S. sales figures for both models. Insight sales have fluctuated drastically because Honda has produced the model in several short spans (1999-2006, 2009-2014, 2018-2022).
| Year | Insight Sales | Prius Sales |
|---|---|---|
| 2005 | 666 | 107,155 |
| 2006 | 722 | 106,971 |
| 2007 | 3 | 181,221 |
| 2008 | - | 158,884 |
| 2009 | 20,572 | 150,831 |
| 2010 | 20,962 | 140,928 |
| 2011 | 15,549 | 136,464 |
| 2012 | 6,619 | 236,655 |
| 2013 | 4,802 | 234,228 |
| 2014 | 3,965 | 207,372 |
| 2015 | 1,458 | 184,794 |
| 2016 | 67 | 136,629 |
| 2017 | 3 | 108,661 |
| 2018 | 12,513 | 87,590 |
| 2019 | 23,686 | 69,718 |
| 2020 | 15,932 | 43,525 |
| 2021 | 18,685 | 59,010 |
| 2022 | 7,628 | 33,352 |
Source: goodcarbadcar.net
The Prius may have dominated the hybrid market for a long time, but it too has run into troubles. Sales have been declining since 2014, even setting historic lows in recent years.
There are several reasons behind this trend, with one being a wider availability of hybrid models from other brands. We also can’t ignore the release of the Tesla Model 3, which began shipping to customers in 2017.
Electric Vehicles
We’re currently in the middle of a historic transition to electric vehicles. However, because EVs do not use fuel, the EPA had to develop a new system called MPGe (miles per gallon of gasoline-equivalent).
This new metric gives us the ability to compare the efficiency of EVs with traditional gas-powered cars. An underlying assumption of MPGe is that 33.7 kilowatt-hours (kWh) of electricity is comparable to the energy content of a gallon of fuel.
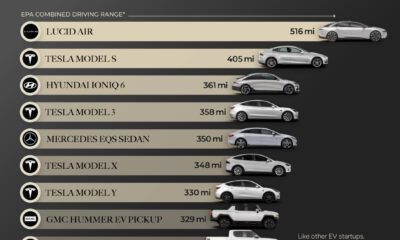
The most fuel efficient car you can buy today is the 2023 Lucid Air, which achieves 140 MPGe. Close behind it is the 2023 Tesla Model 3 RWD, which is rated at 132 MPGe.
Check out this page to see the EPA’s top 10 most efficient vehicles for 2023.


Automotive
Interactive: Comparing Carmaker Revenue vs. Country GDP
This graphic looks at the revenue of the world’s top carmakers and compares them to the GDP of 196 countries worldwide.
 Creator Program
Comparing Carmaker Revenue vs. Country GDP
As of July 2022, the global car and manufacturing market was worth about $2.9 trillion.
What companies are currently dominating this massive industry, and how much revenue do they generate on a yearly basis compared to the economic output of countries?
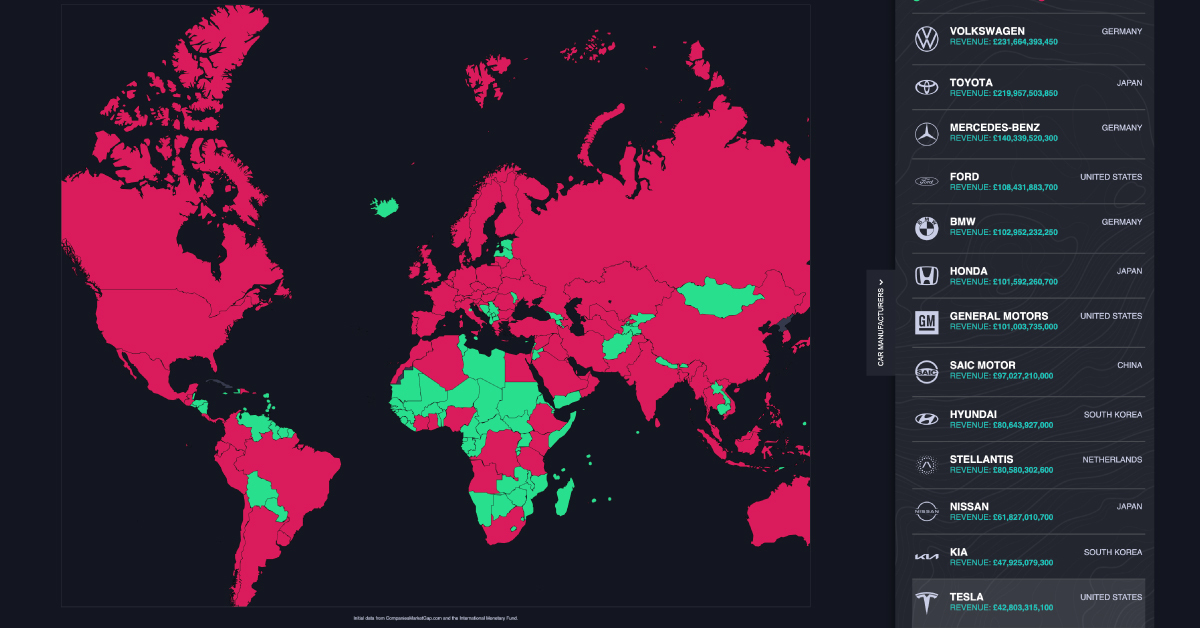
To help put things into perspective, this graphic by Vanarama looks at the revenue of the world’s top carmakers, and compares each company’s revenue to the gross domestic product (GDP) of 196 countries worldwide.
The World’s Largest Carmakers by Revenue
Based on data from CompaniesMarketCap.com, here’s a look at some of the biggest carmakers in the world, and how much revenue they brought in from Q1 2021 to Q1 2022:
| Rank | Carmaker | Revenue (Q1 2021 to Q1 2022) | Country of origin |
|---|---|---|---|
| 1 | Volkswagen | $291 billion | 🇩🇪 Germany |
| 2 | Toyota | $276 billion | 🇯🇵 Japan |
| 3 | Mercedes-Benz | $176 billion | 🇩🇪 Germany |
| 4 | Ford | $136 billion | 🇺🇸 United States |
| 5 | BMW | $129 billion | 🇩🇪 Germany |
| 6 | Honda | $127 billion | 🇯🇵 Japan |
| 7 | General Motors | $127 billion | 🇺🇸 United States |
| 8 | SAIC Motor | $122 billion | 🇨🇳 China |
| 9 | Hyundai | $101 billion | 🇰🇷 South Korea |
| 10 | Stellantis | $101 billion | 🇳🇱 Netherlands |
| 11 | Nissan | $77 billion | 🇯🇵 Japan |
| 12 | Kia | $60 billion | 🇰🇷 South Korea |
| 13 | Tesla | $53 billion | 🇺🇸 United States |
| 14 | Renault | $52 billion | 🇫🇷 France |
| 15 | BYD | $33 billion | 🇨🇳 China |
| 16 | Suzuki Motor | $31 billion | 🇯🇵 Japan |
| 17 | Volvo Car | $31 billion | 🇸🇪Sweden |
| 18 | Mazda | $27 billion | 🇯🇵 Japan |
| 19 | Subaru | $24 billion | 🇯🇵 Japan |
| 20 | Isuzu | $21 billion | 🇯🇵 Japan |
In first place was German car manufacturer Volkswagen, which generated about $291 billion in revenue between Q1 2022 and Q1 2022—that’s more spending power than 76% of the countries included in the dataset.
In 2021, Volkswagen’s best-selling vehicles were the Tiguan, a mid-size SUV, and the Polo, a compact hatchback. In addition to the Volkswagen brand, the company itself owns a handful of luxury car brands including Audi, Bentley, and Porsche.
Toyota came in second place, with a total of $276 billion in revenue from Q1 2021 to Q1 2022. While the Japanese manufacturer is popular in its country of origin, America is actually its largest market—in 2021, more than 2.3 million Toyota vehicles were sold in the United States, nearly double the amount sold in Japan.
How Important are These Brands to Their Countries’ GDPs?
As this graphic illustrates, these car manufacturers generate billions in revenue each year. Their financial power is so significant, they’ve become big parts of their home countries’ national economies.
But just how important are these brands to their countries of origin? Here’s a look at 20 different carmakers, as a percentage of their country of origin’s GDP:
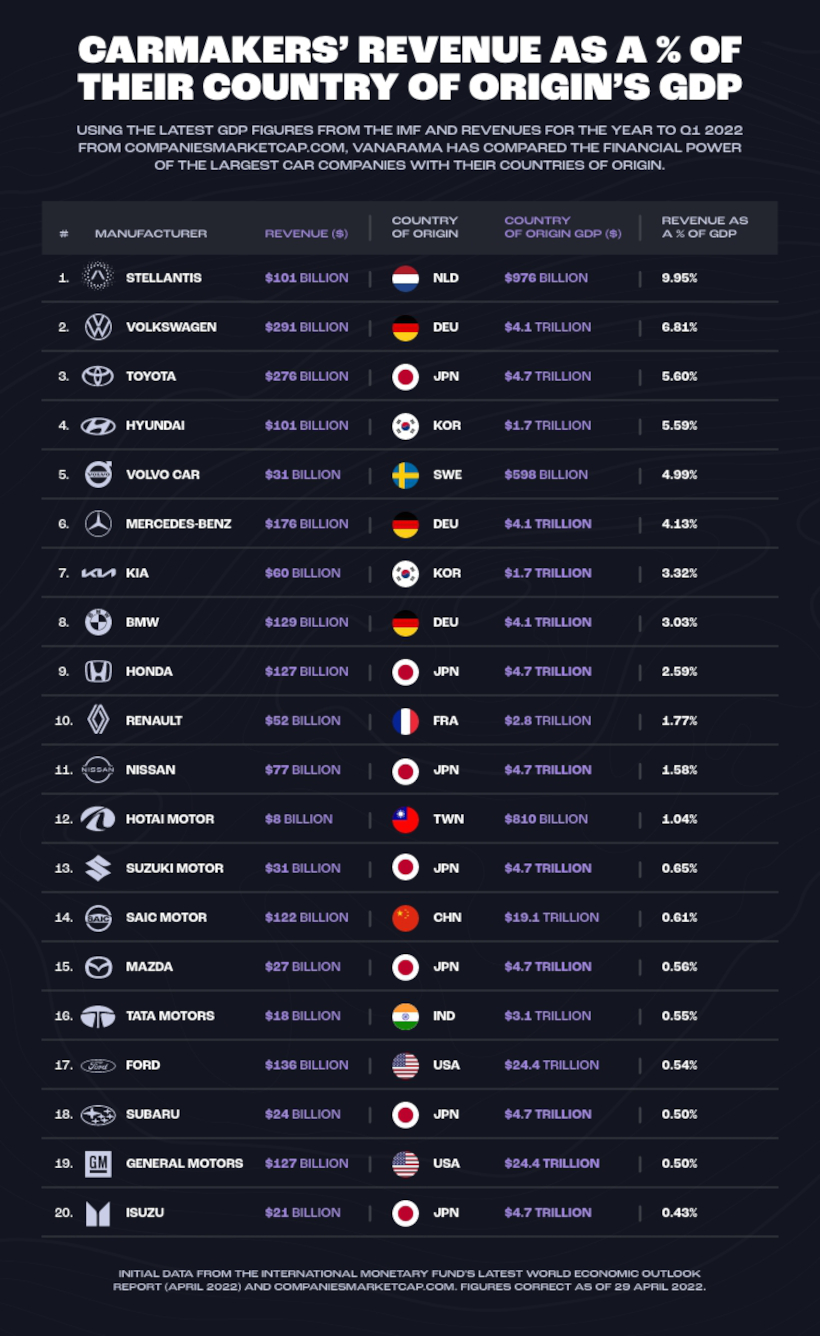
One carmaker is nearly in the double digits—the revenue from Dutch automobile manufacturer Stellantis is equivalent to approximately 9.95% of the Netherland’s GDP.
Founded in 2021, Stellantis is comprised of 16 different international car brands, including well-known Europeans brands like Vauxhall and Citroen, as well as some American manufacturers like Dodge and Chrysler.
Other countries also have a large combined output from automakers, including Japan (11.91%) and Germany (13.97%).
But it’s important to note that each company’s revenue is not wholly contained in their home country’s GDP. Many major automakers have international subsidiaries for localized production, with revenue falling under those countries’ GDPs.

-

 Green5 days ago
Hotter Than Ever: 2023 Sets New Global Temperature Records
-

 Datastream4 weeks ago
Can You Calculate Your Daily Carbon Footprint?
-

 Energy2 weeks ago
Who’s Still Buying Russian Fossil Fuels in 2023?
-

 VC+4 days ago
What’s New on VC+ in July
-

 Investor Education4 weeks ago
Visualizing BlackRock’s Top Equity Holdings
-

 Technology2 weeks ago
Meet the Competing Apps Battling for Twitter’s Market Share
-

 Politics15 hours ago
How Do Chinese Citizens Feel About Other Countries?
-

 Markets4 weeks ago
Visualizing Every Company on the S&P 500 Index