Technology
Mapped: The Most Innovative Countries in the World in 2022
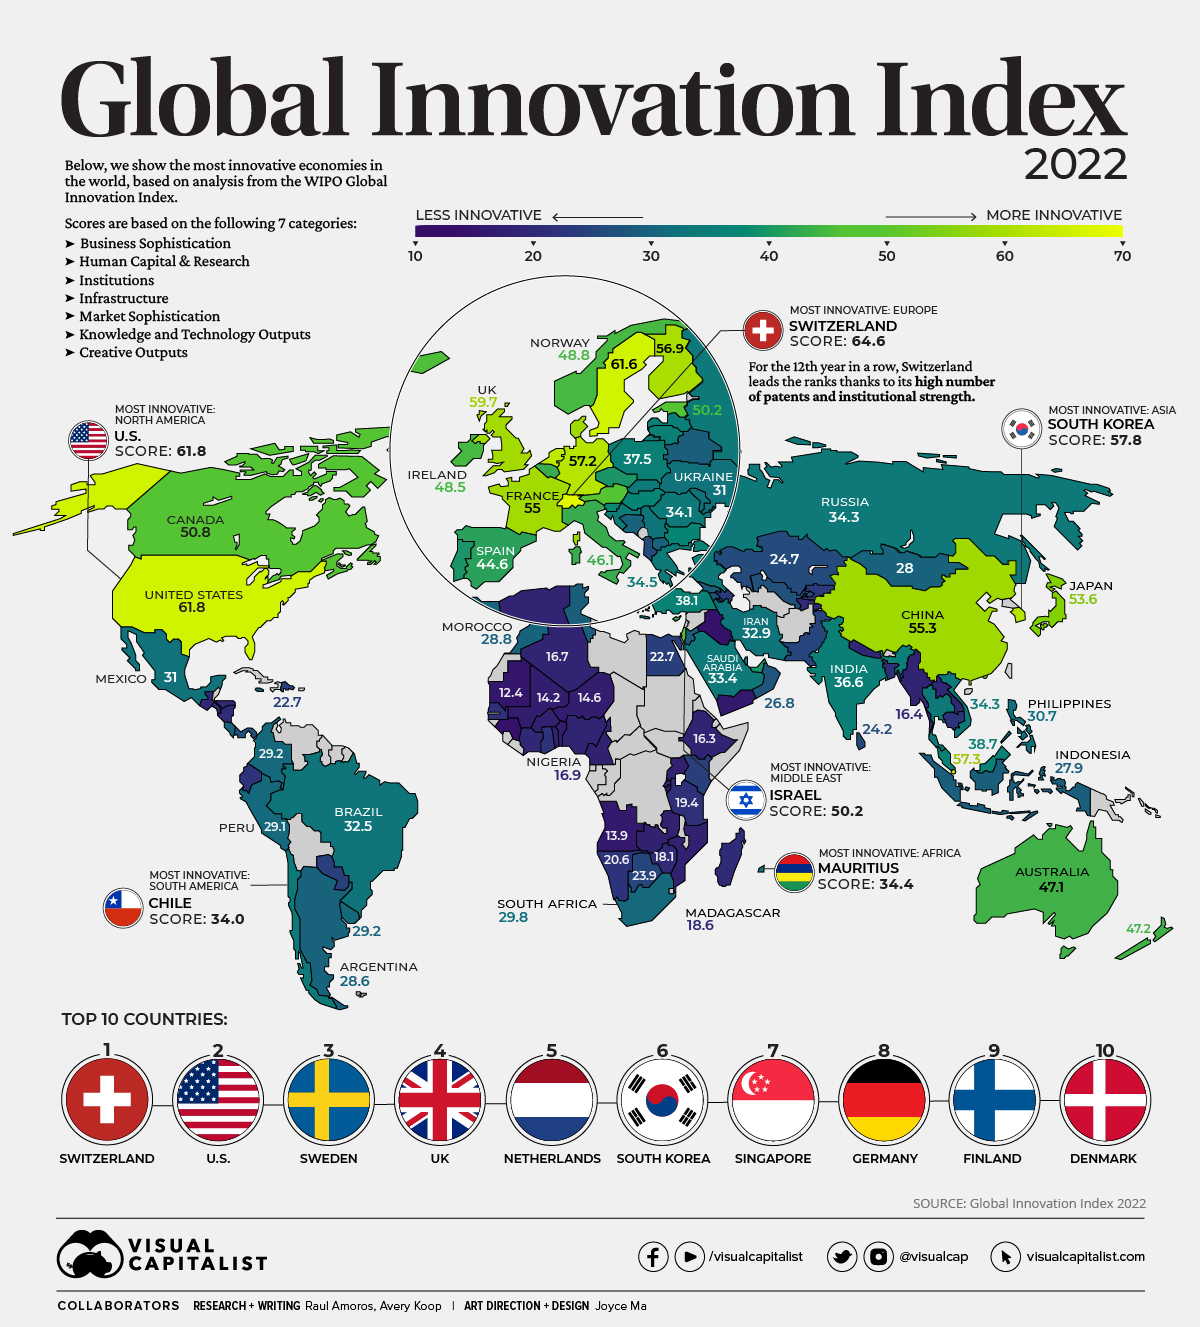


The Most Innovative Countries in the World 2022
Since 2000, global investment in research and development (R&D) has tripled to $2.4 trillion.
R&D spend is also casting a wider global net. In 1960, the U.S. made up nearly 70% of global R&D spending, and by 2020 this had fallen to 30%. From job creation and public health to national security and industrial competitiveness, R&D plays a vital role in a country’s economic growth and innovation, impacting nearly every corner of society—either directly or indirectly.
Along with R&D spend, other key ingredients play an important role in driving progress and innovation. These include technological adoption, scientific research, and venture capital activity, among others.
The above infographic ranks the world’s most innovative economies using data from the UN’s WIPO Global Innovation Index.
What Defines an Innovative Economy?
Innovation is inherently challenging to quantify, but the Global Innovation Index is a longstanding attempt to do just that.
The framework used for the index was designed to create a more complete analysis, comprising of 81 indicators across seven categories to calculate a country’s score:
| 7 Categories | Example Indicators |
|---|---|
| 🧳 Business Sophistication | Business R&D spend, net inflows of foreign direct investment |
| 📈 Market Sophistication | Size of economy’s GDP, intensity of local market competition |
| 🛣️ Infrastructure | Road, hospital, school construction, energy efficiency |
| 👩🏫 Human Capital & Research | Government funding per pupil, quality of scientific and research institutions |
| 🏛️ Institutions | Political stability and safety, ease of starting a business |
| 💡 Creative Outputs | Most valuable brands, industrial design applications, trademark applications |
| 👨💻 Knowledge and Technology Outputs | Patent applications, increase in labor productivity, spending on software |
As the above table shows, the framework aims to identify indicators that foster an innovative environment and breakthrough technologies.
It’s worth noting that each country’s overall innovation score is a mix of these categories, and countries with similar scores can be strong in different areas.
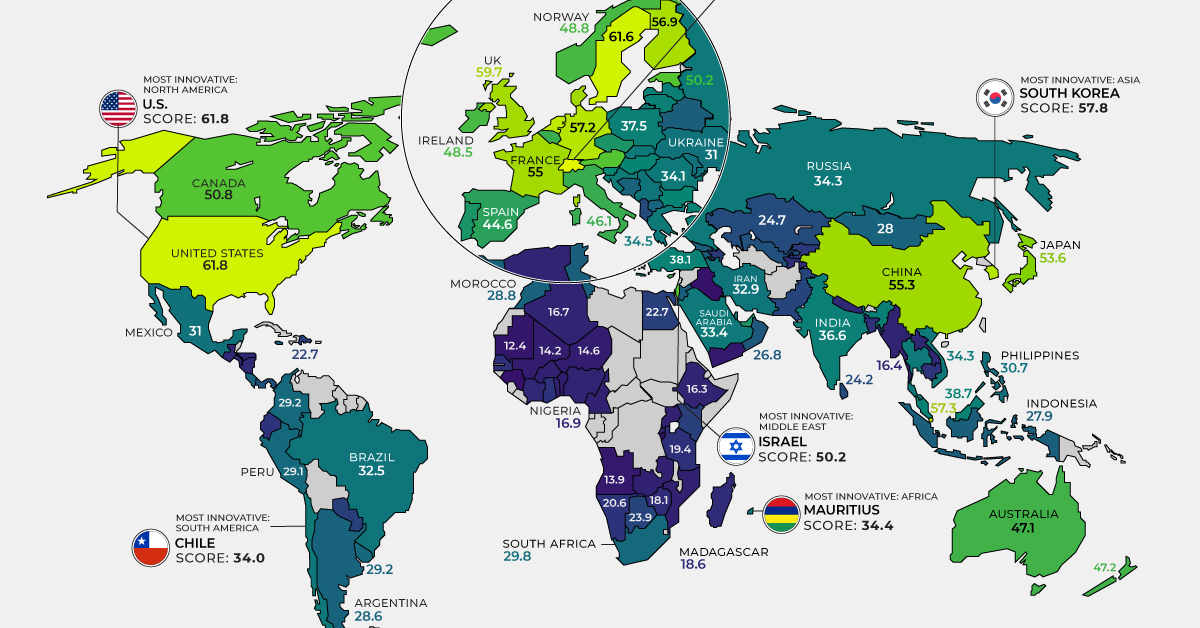
The 50 Most Innovative Countries in 2022
Switzerland ranks at the top for the 12th year in a row—above the U.S., South Korea, and Israel.
For many, this may come as a surprise. However, the country’s intellectual property rules are considered world-class, and they are complemented by strong collaboration between universities and industry. In addition, the country attracts top talent thanks to its high quality of living.
At second is the United States, which is a top spender on R&D at over $700 billion per year. Globally, four of the five top R&D spending companies are in America: Amazon ($42.7 billion), Alphabet ($27.6 billion), Microsoft ($19.3 billion), and Apple ($18.8 billion).
| Rank | Country / Region | Score |
|---|---|---|
| 1 | 🇨🇭 Switzerland | 64.6 |
| 2 | 🇺🇲 U.S. | 61.8 |
| 3 | 🇸🇪 Sweden | 61.6 |
| 4 | 🇬🇧 United Kingdom | 59.7 |
| 5 | 🇳🇱 Netherlands | 58.0 |
| 6 | 🇰🇷 South Korea | 57.8 |
| 7 | 🇸🇬 Singapore | 57.3 |
| 8 | 🇩🇪 Germany | 57.2 |
| 9 | 🇫🇮 Finland | 56.9 |
| 10 | 🇩🇰 Denmark | 55.9 |
| 11 | 🇨🇳 China | 55.3 |
| 12 | 🇫🇷 France | 55.0 |
| 13 | 🇯🇵 Japan | 53.6 |
| 14 | 🇭🇰 Hong Kong | 51.8 |
| 15 | 🇨🇦 Canada | 50.8 |
| 16 | 🇮🇱 Israel | 50.2 |
| 17 | 🇦🇹 Austria | 50.2 |
| 18 | 🇪🇪 Estonia | 50.2 |
| 19 | 🇱🇺 Luxembourg | 49.8 |
| 20 | 🇮🇸 Iceland | 49.5 |
| 21 | 🇲🇹 Malta | 49.1 |
| 22 | 🇳🇴 Norway | 48.8 |
| 23 | 🇮🇪 Ireland | 48.5 |
| 24 | 🇳🇿 New Zealand | 47.2 |
| 25 | 🇦🇺 Australia | 47.1 |
| 26 | 🇧🇪 Belgium | 46.9 |
| 27 | 🇨🇾 Cyprus | 46.2 |
| 28 | 🇮🇹 Italy | 46.1 |
| 29 | 🇪🇸 Spain | 44.6 |
| 30 | 🇨🇿 Czech Republic | 42.8 |
| 31 | 🇦🇪 United Arab Emirates | 42.1 |
| 32 | 🇵🇹 Portugal | 42.1 |
| 33 | 🇸🇮 Slovenia | 40.6 |
| 34 | 🇭🇺 Hungary | 39.8 |
| 35 | 🇧🇬 Bulgaria | 39.5 |
| 36 | 🇲🇾 Malaysia | 38.7 |
| 37 | 🇹🇷 Turkey | 38.1 |
| 38 | 🇵🇱 Poland | 37.5 |
| 39 | 🇱🇹 Lithuania | 37.4 |
| 40 | 🇮🇳 India | 36.6 |
| 41 | 🇱🇻 Latvia | 36.5 |
| 42 | 🇭🇷 Croatia | 35.6 |
| 43 | 🇹🇭 Thailand | 34.9 |
| 44 | 🇬🇷 Greece | 34.5 |
| 45 | 🇲🇺 Mauritius | 34.4 |
| 46 | 🇸🇰 Slovakia | 34.3 |
| 47 | 🇷🇺 Russia | 34.3 |
| 48 | 🇻🇳 Vietnam | 34.3 |
| 49 | 🇷🇴 Romania | 34.1 |
| 50 | 🇨🇱 Chile | 34.0 |
Countries across Europe also feature prominently in the top 10, including Sweden (#3), the United Kingdom (#4) and the Netherlands (#5).
South Korea (#6), is known for its high R&D intensity. This is driven by its industrial conglomerates, known as chaebols, that are generally family-owned. Samsung and LG are among its largest companies, known for their high degree of corporate-academic collaboration.
Below, we will take a closer look at the most innovative countries by region.
North America
In North America, the U.S. ranks highest. The country has long been known as a global leader in innovation, with a strong track record of introducing new ideas and technologies that have transformed the way we live and work. The U.S. ranks #1 in a number of indicators, including university-industry R&D collaboration and intangible asset intensity.
Ranking second in the region is Canada (Global rank: #15). Across all countries, it ranks first on measures of joint venture and strategic alliances per billion dollars of GDP (PPP) and number of venture capital (VC) recipients per billion dollars of GDP (PPP). In 2021, VC investment topped $14.7 billion across 752 deals.
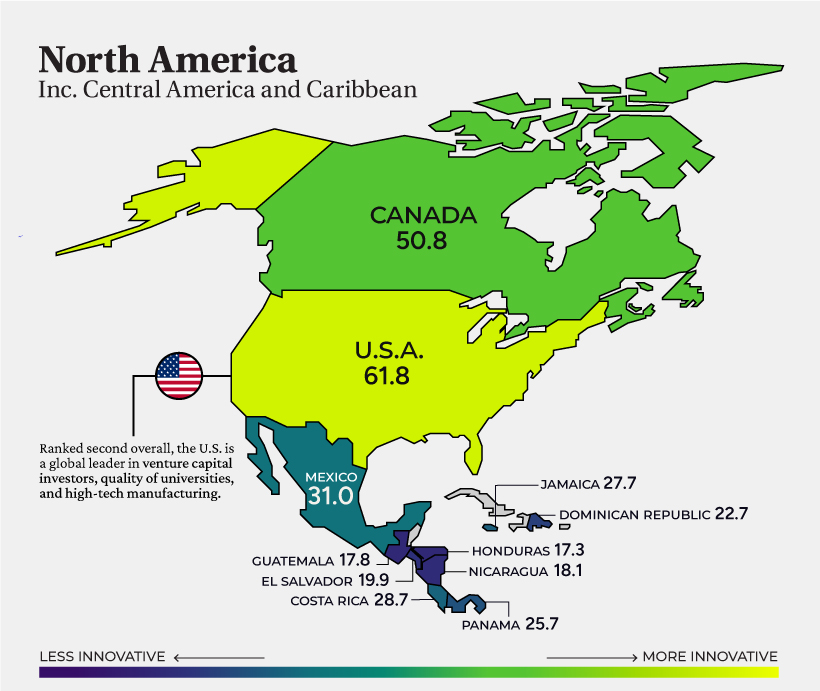
Another interesting example is Honduras (#113). Driving innovation in the country is a new economic zoning experiment called Zones for Economic Development and Employment (ZEDEs).
To date, these zones have attracted about a quarter of a billion dollars in private investment funding and have created thousands of new jobs.
South America
Chile (#50) ranks first across the region, thanks to its promising tech sector. To date, it is home to an estimated 8,000 tech companies. The country also has the highest scale of mobile connectivity in the region. In late 2021, it launched the first 5G network in South America.
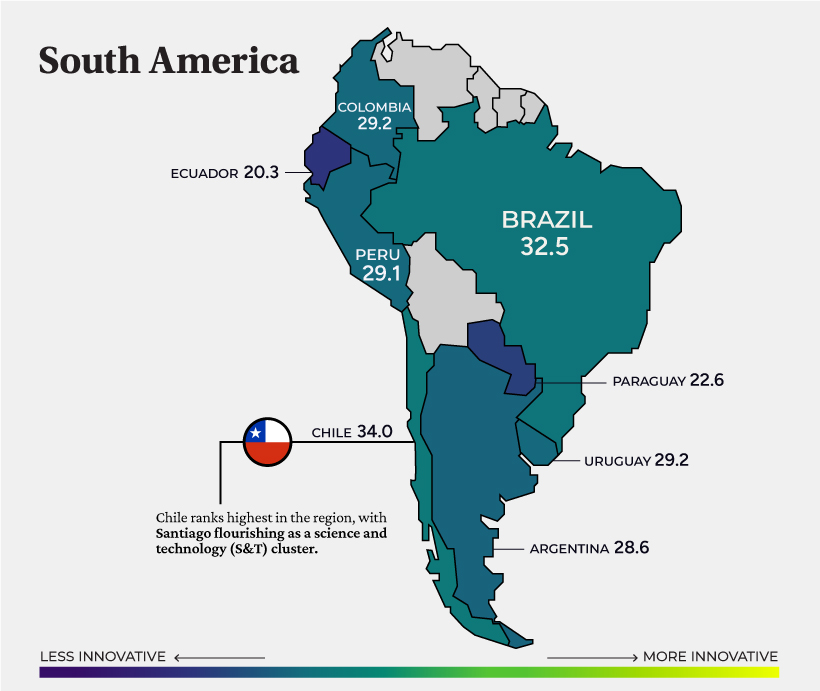
Following Chile is Brazil (#54), which saw a record number of IPOs in 2021 that were valued at nearly $7 billion.
Middle East and Central Asia
As the highest ranked in the region, Israel (#16) is the sole country globally that spends over 5% of GDP on R&D. Overall, it is a global leader in patent applications and information and communication technology (ICT) services exports.
For context, the country’s density of start-ups per capita is 16 times that of Europe.
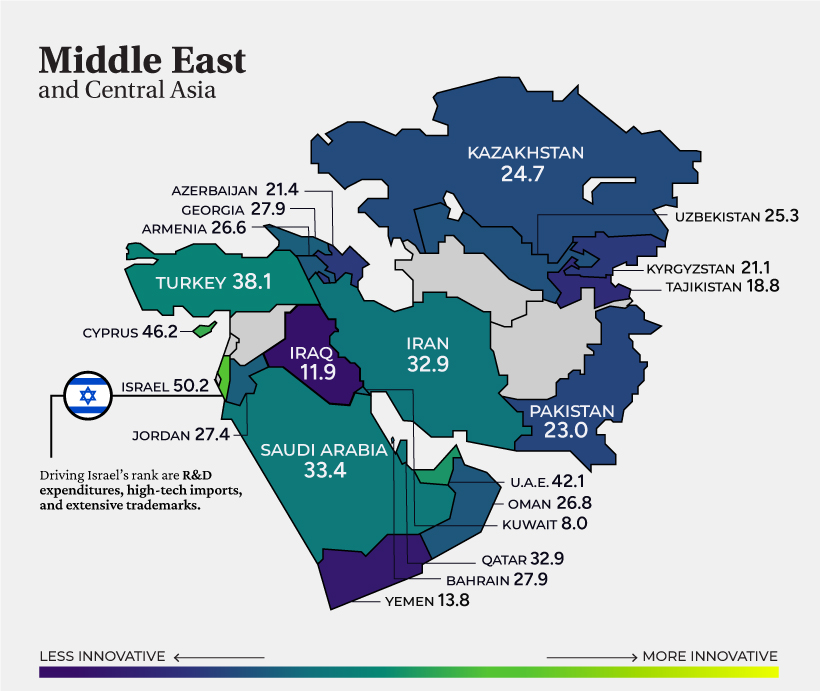
The small island nation of Cyprus (#27) follows in second, supported by government funding focused on start-ups. Meanwhile, Turkey (#37) in fourth, is home to six unicorns*, fostered by its development of a megatech corridor through Istanbul to Izmir.
*A unicorn is a privately-held startup that has a valuation of over $1 billion.
Europe
With 15 of the top 25 economies in the world, Europe is a powerhouse for fostering innovative ecosystems.
The continent is also a leader in social progress, equality, and life satisfaction. The region scores 30 on inequality according to the Gini Index compared to 41 for America.
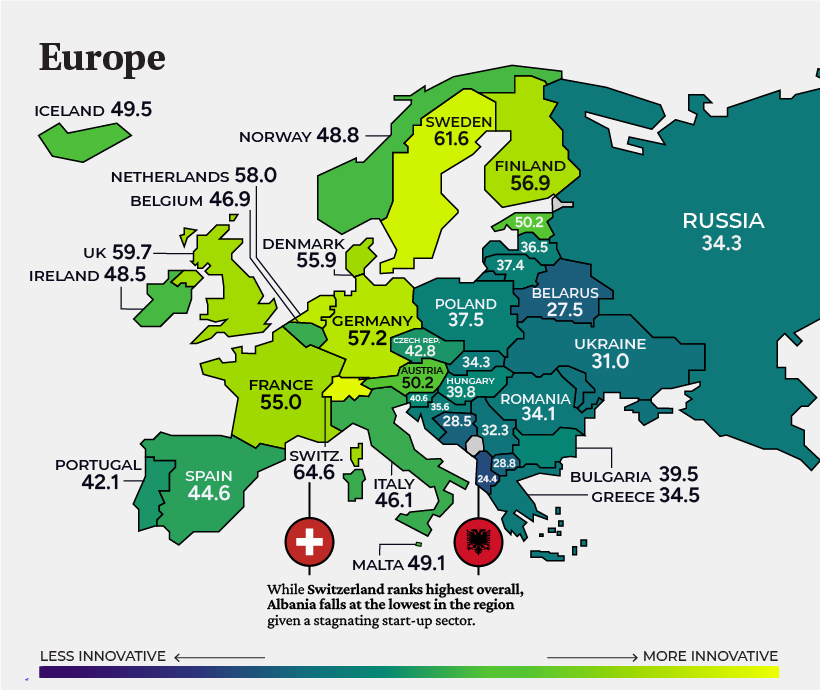
For many, technological output isn’t the first thing that comes to mind when they think of Europe, but VC deals surged over 53% in 2021. London, Berlin, and Paris were leading cities for VC activity.
East Asia and Oceania
South Korea (#6) ranks highest across East Asia and Oceania, and has established itself as a leader in technology and innovation on the global stage. Through its New Deal initiative, the government is spearheading projects on smart healthcare, AI, and smart industrial complexes. At the same time, it is accelerating the construction of eco-friendly infrastructure and renewable energy.
South Korea’s Hyundai and its subsidiary Kia have made considerable ground in electric vehicle (EV) production, comprising 9% of the U.S. EV market, the second-highest share after Tesla.
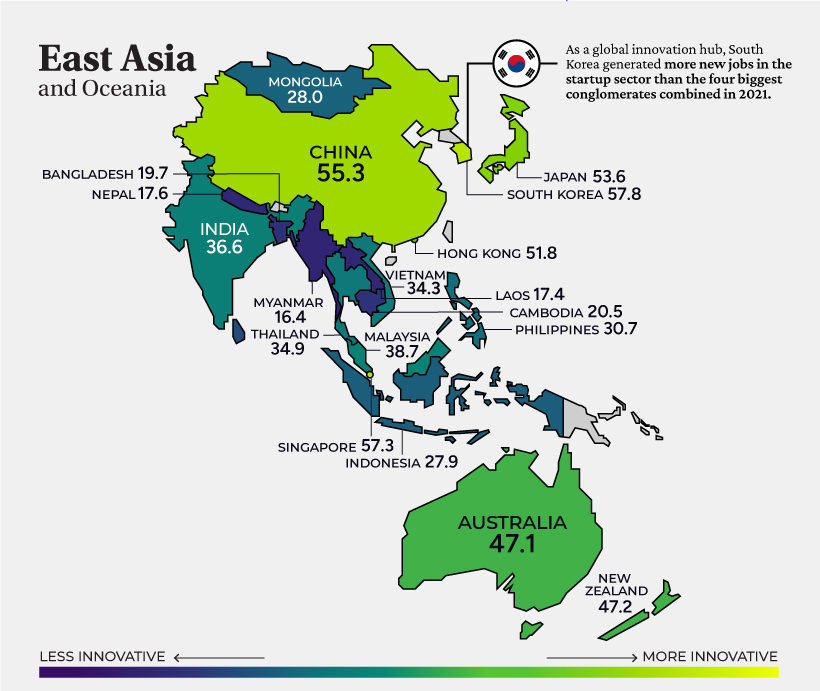
China sits just outside the global top 10, and now ranks #1 in multiple indicators, including labor productivity growth and trademarks by origin. China’s economic output per employed worker increased an impressive 4.2% annually from 2011 to 2019, on average.
Africa
The highest ranked in Africa is the island nation of Mauritius (#45).
Underscoring its rank is the strength of its institutions and market sophistication. Meanwhile, the government is accelerating investment in tech incubators, research-business collaboration, and tax incentives for R&D investment.
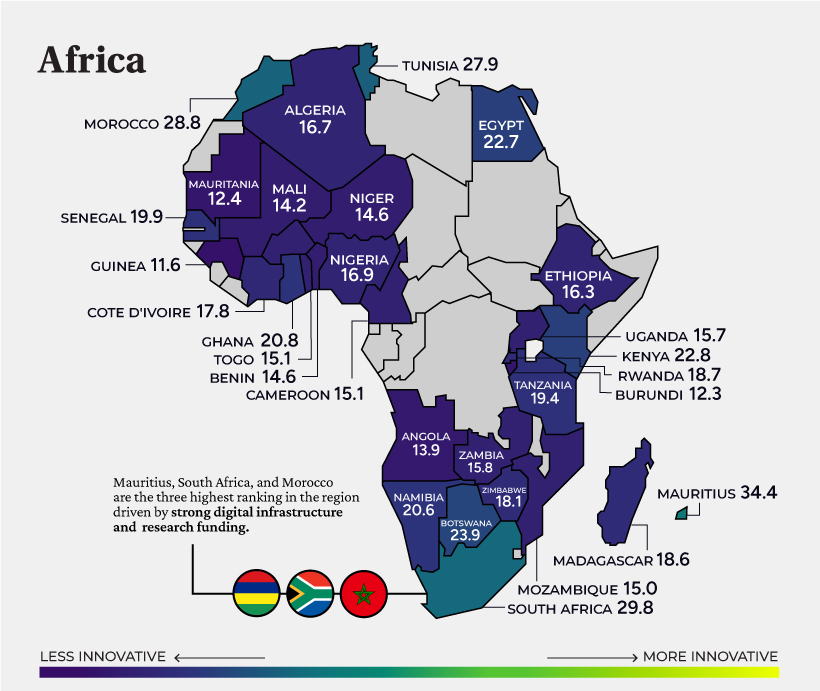
South Africa (#61) follows Mauritius on the list, with the city of Cape Town attracting a proposed $300 million Amazon headquarters.
Panasonic opened their headquarters in Cape Town in 2018. Oracle, IBM, Google, and Microsoft also have offices in the country’s expanding tech hub.


apps
How Long it Took for Popular Apps to Reach 100 Million Users
Threads reached 100 million users in just five days. Here is a timeline of how long other popular platforms took to reach the milestone.
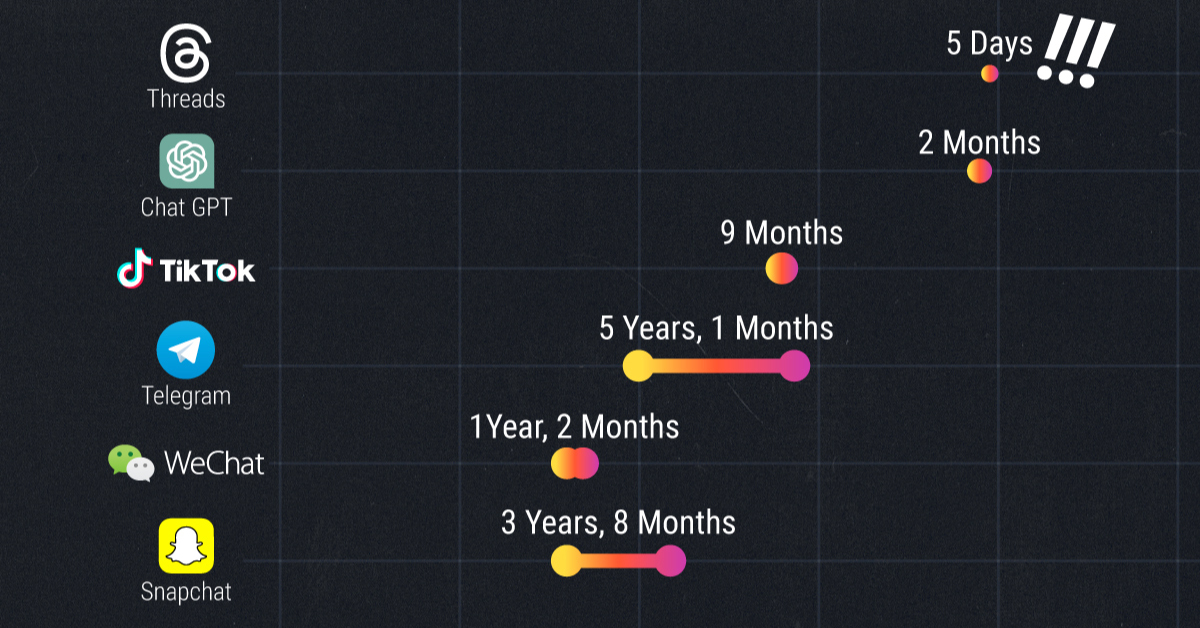
How Long it Took for Popular Apps to Reach 100 Million Users
Of Twitter’s many new rivals, Meta’s newest social media platform Threads has established its presence with a bang.
According to Meta founder Mark Zuckerberg, Threads took only 5 days to reach the key threshold of 100 million users. It achieved this milestone through organic demand—and no paid promotions required—smashing all previous records.
But how long have other popular platforms—TikTok, Instagram, and YouTube to name a few—taken to build their user base? Pulling data from PwC and Yahoo, we rank how long it took popular platforms to get to 100 million users.
Ranking Every Apps Journey to 100 Million Users
In first place, Threads has a significant lead over the rest of the pack with its five day achievement, and may have built a significant moat in holding on to this record.
Firstly, its launch coincided with Twitter’s viewing limit decision, and rode the wave of dissatisfaction aimed at Twitter’s current owner, Elon Musk.
Secondly, new users on Threads need an Instagram account to register, thus eliminating sign-up barriers and leveraging Instagram’s 1.2 billion-strong user base.
Here’s the journey length of popular platforms to attaining 100 million users:
| Rank | Platform | Launch | Time to 100M Users |
|---|---|---|---|
| 1 | Threads | 2023 | 5 days |
| 2 | ChatGPT | 2022 | 2 months |
| 3 | TikTok | 2017 | 9 months |
| 4 | 2011 | 1 year, 2 months | |
| 5 | 2010 | 2 years, 6 months | |
| 6 | Myspace | 2003 | 3 years |
| 7 | 2009 | 3 years, 6 months | |
| 8 | Snapchat | 2011 | 3 years, 8 months |
| 9 | YouTube | 2005 | 4 years, 1 month |
| 10 | 2004 | 4 years, 6 months | |
| 11 | Spotify | 2006 | 4 years, 7 months |
| 12 | Telegram | 2013 | 5 years, 1 month |
| 13 | 2006 | 5 years, 5 months | |
| 14 | Uber | 2011 | 5 years, 10 months |
| 15 | 2010 | 5 years, 11 months | |
| 16 | Google Translate | 2006 | 6 years, 6 months |
| 17 | World Wide Web | 1991 | 7 years |
| 18 | 2003 | 7 years, 11 months |
Ranked second, Open AI’s ChatGPT launched in November 2022 and hit 100 million users by the start of the new year. ChatGPT introduced the incredible capabilities of large language models to the masses, prompting a rush of sign-ups, and reviving old conversations around the potential consequences of AI.
Coming in at third place, ByteDance’s TikTok took just 9 months to reach 100 million users after its launch in 2017. Like Threads, TikTok benefited from another app, accessing popular lip syncing app Musical.ly’s existing user base after it was acquired and folded into TikTok.
WeChat and Instagram round out the top-five, also with interesting advantages. WeChat, an instant messaging platform similar to WhatsApp, benefited from its unique access to China’s notoriously closed internet market of 500 million users in 2012.
Meanwhile, Meta acquired Instagram when the photo-sharing platform had 30 million users, and more than tripled that number past 100 million in just one year.
And while Facebook ranks solidly middle-of-the-pack for fastest to 100 million users, it remains the platform with the most monthly active accounts, at nearly 3 billion. In fact, Meta’s lessons learned from Facebook have been well-leveraged, and the company owns 4 of the fastest apps to register 100 million users.
So What Does Threads Success Mean for Twitter?
Coming back to Threads’ incredible feat, however, it’s still early days whether an en-masse switch from Twitter is on the cards for Meta’s newest platform.
For one, Threads has faced significant criticism due to its intensive data collection practices and lack of accessibility features. It also is missing some key features from its rival, including trending topics, hashtags, and direct messages.
Meanwhile Elon Musk has been less than pleased with Threads’ success, deeming it a copy of Twitter and even threatening legal action.
Competition is fine, cheating is not
— Elon Musk (@elonmusk) July 6, 2023
So where does this leave the increasingly-crowded social media space? The next decade will set the stage for either more platform consolidation, or even further audience fragmentation.
-

 Politics18 hours ago
How Do Chinese Citizens Feel About Other Countries?
-

 Markets4 weeks ago
Visualizing Every Company on the S&P 500 Index
-

 Economy2 weeks ago
Visualizing 1 Billion Square Feet of Empty Office Space
-

 Energy4 weeks ago
Life Cycle Emissions: EVs vs. Combustion Engine Vehicles
-

 History2 weeks ago
Vintage Viz: The World’s Rivers and Lakes, Organized Neatly
-

 United States3 weeks ago
Visualized: The 100 Largest U.S. Banks by Consolidated Assets
-

 AI1 week ago
Charted: Changing Sentiments Towards AI in the Workplace
-

 VC+3 weeks ago
What are Top Investment Managers Holding in Their Portfolios?