Datastream
High Wage vs. Low Wage: Comparing Economic Recovery in America


The Briefing
- The economic recession caused by COVID-19 has been especially devastating for low wage workers
- While the recession is nearly over for high income earners, fewer than half the jobs lost this spring are back for those making under $20/hr
High Wage vs Low Wage: Different Economic Recoveries
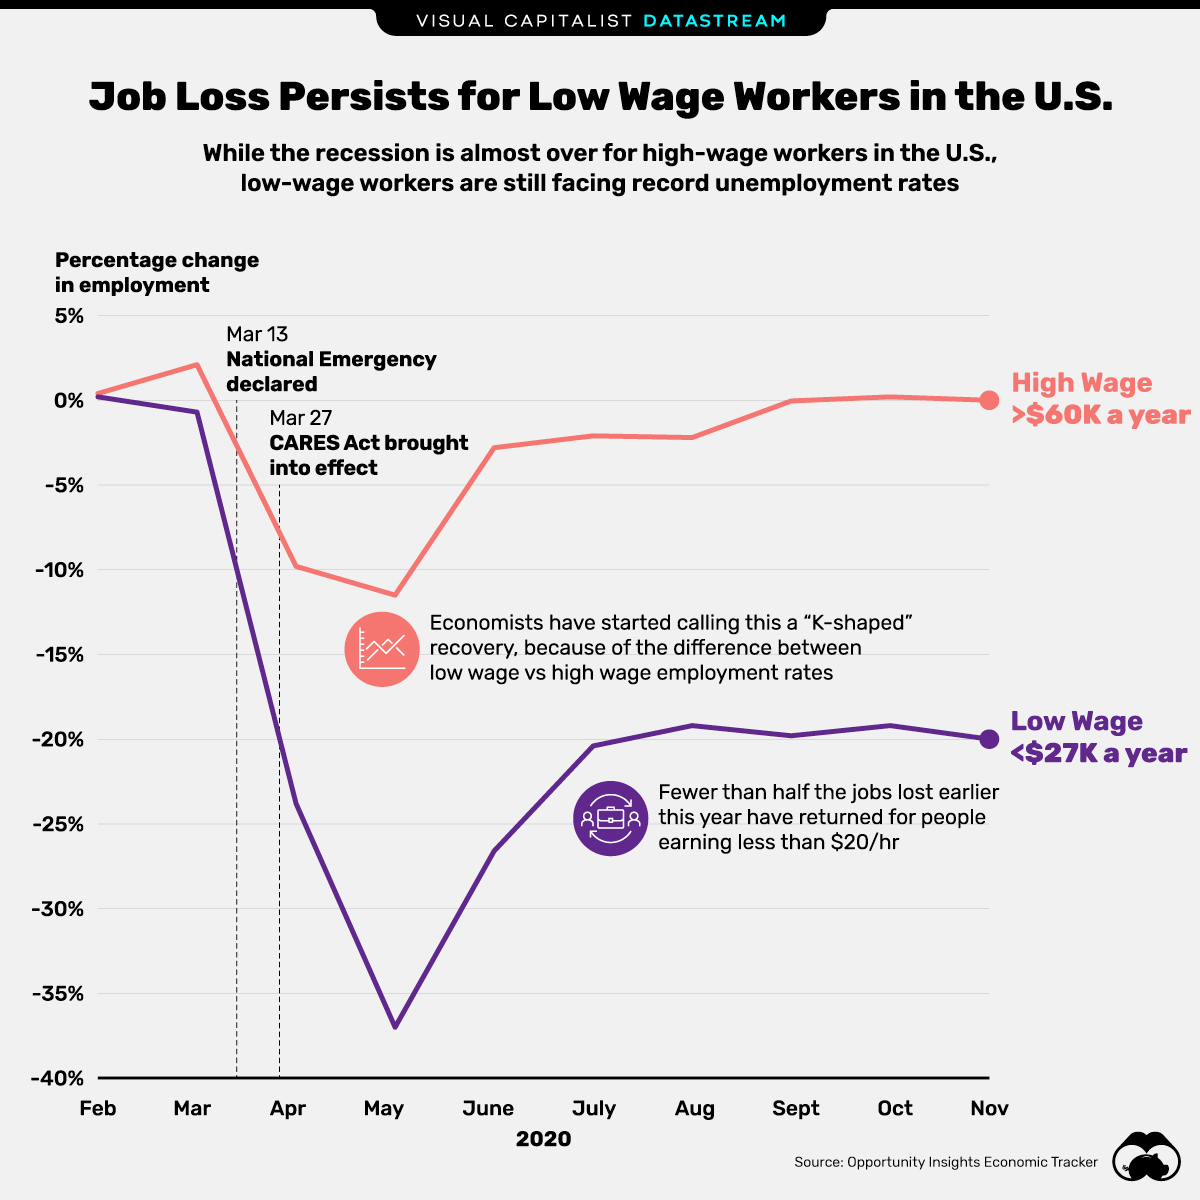
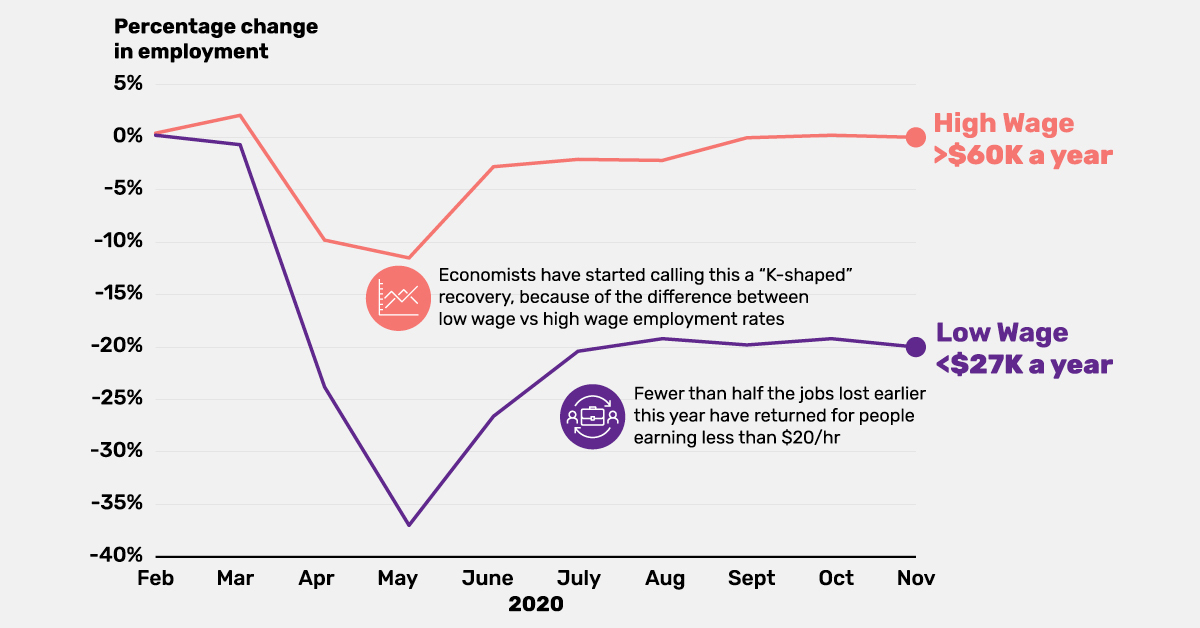
While it’s not uncommon for low wage workers to bear the brunt of an economic recession, this year’s economic collapse has been exceptionally brutal for America’s lower income employees.
Employment rates for high wage workers have bounced back from their spring slump, but unfortunately, the recovery hasn’t been as pronounced for low income workers.
Less than half the jobs lost earlier this year have returned for those making under $20 per hour. To give you a broader perspective, here’s a look at the percent change of employment rates from February through to November 2020:
| Date | High Wage Workers (>$60k) | Low Wage Workers (<$27k) |
| Feb 1, 2020 | 0.4% | 0.2% |
| Mar 1, 2020 | 2.1% | -0.7% |
| Apr 1, 2020 | -9.8% | -23.8% |
| May 1, 2020 | -11.5% | -37.0% |
| June 1, 2020 | -2.8% | -26.6% |
| July 1, 2020 | -2.1% | -20.4% |
| Aug 1, 2020 | -2.2% | -19.2% |
| Sept 1, 2020 | -0.0% | -19.8% |
| Oct 1, 2020 | 0.2% | -19.2% |
| Nov 1, 2020 | 0.0% | -20.0% |
*Note: Percentage changes are compared to U.S. employment rates from January 2020.
As the table above shows, this recession has been tough for low wage workers. But why?
It’s Not You, It’s Your Industry
There are various elements at play, but one key factor driving this unequal recession is the type of work that’s been impacted by the global pandemic.
The sectors that have been most affected, such as accommodation and food services, are the industries that typically employ low wage workers. On the flip side, many high income workers are employed in industries that allow them to work from home.
Although several COVID-19 vaccines are now in sight, a return to “normal” can’t come soon enough for workers in hard-hit industries such as travel, tourism, and food services.
» Interested in learning more about COVID-19’s impact on the U.S. economy? Check out our full article: America’s $2 Trillion Economic Drop, by State and Sector
Where does this data come from?
Source: Opportunity Insights Economic Tracker.
Notes: This tracker was built using anonymized data from several private companies, such as credit card processors and payroll firms.


Datastream
Can You Calculate Your Daily Carbon Footprint?
Discover how the average person’s carbon footprint impacts the environment and learn how carbon credits can offset your carbon footprint.


The Briefing
- A person’s carbon footprint is substantial, with activities such as food consumption creating as much as 4,500 g of CO₂ emissions daily.
- By purchasing carbon credits from Carbon Streaming Corporation, you can offset your own emissions and fund positive climate action.
Your Everyday Carbon Footprint
While many large businesses and countries have committed to net-zero goals, it is essential to acknowledge that your everyday activities also contribute to global emissions.
In this graphic, sponsored by Carbon Streaming Corporation, we will explore how the choices we make and the products we use have a profound impact on our carbon footprint.
Carbon Emissions by Activity
Here are some of the daily activities and products of the average person and their carbon footprint, according to Clever Carbon.
| Household Activities & Products | CO2 Emissions (g) |
|---|---|
| 💡 Standard Light Bulb (100 watts, four hours) | 172 g |
| 📱 Mobile Phone Use (195 minutes per day)* | 189 g |
| 👕 Washing Machine (0.63 kWh) | 275 g |
| 🔥 Electric Oven (1.56 kWh) | 675 g |
| ♨️ Tumble Dryer (2.5 kWh) | 1,000 g |
| 🧻 Toilet Roll (2 ply) | 1,300 g |
| 🚿 Hot Shower (10 mins) | 2,000 g |
| 🚙 Daily Commute (one hour, by car) | 3,360 g |
| 🍽️ Average Daily Food Consumption (three meals of 600 calories) | 4,500 g |
| *Phone use based on yearly use of 69kg per the source, Reboxed | |
Your choice of transportation plays a crucial role in determining your carbon footprint. For instance, a 15 km daily commute to work on public transport generates an average of 1,464 g of CO₂ emissions. Compared to 3,360 g—twice the volume for a journey the same length by car.
By opting for more sustainable modes of transport, such as cycling, walking, or public transportation, you can significantly reduce your carbon footprint.
Addressing Your Carbon Footprint
One way to compensate for your emissions is by purchasing high-quality carbon credits.
Carbon credits are used to help fund projects that avoid, reduce or remove CO₂ emissions. This includes nature-based solutions such as reforestation and improved forest management, or technology-based solutions such as the production of biochar and carbon capture and storage (CCS).
While carbon credits offer a potential solution for individuals to help reduce global emissions, public awareness remains a significant challenge. A BCG-Patch survey revealed that only 34% of U.S. consumers are familiar with carbon credits, and only 3% have purchased them in the past.
About Carbon Streaming
By financing the creation or expansion of carbon projects, Carbon Streaming Corporation secures the rights to future carbon credits generated by these sustainable projects. You can then purchase these carbon credits to help fund climate solutions around the world and compensate for your own emissions.
Ready to get involved?
>> Learn more about purchasing carbon credits at Carbon Streaming
-

 Environment5 days ago
Hotter Than Ever: 2023 Sets New Global Temperature Records
-

 Datastream4 weeks ago
Can You Calculate Your Daily Carbon Footprint?
-

 Energy2 weeks ago
Who’s Still Buying Russian Fossil Fuels in 2023?
-

 VC+5 days ago
What’s New on VC+ in July
-

 Investor Education4 weeks ago
Visualizing BlackRock’s Top Equity Holdings
-

 Technology2 weeks ago
Meet the Competing Apps Battling for Twitter’s Market Share
-

 Misc18 hours ago
How Do Chinese Citizens Feel About Other Countries?
-

 Markets4 weeks ago
Visualizing Every Company on the S&P 500 Index