Datastream
The U.S. Share of the Global Economy Over Time

The Briefing
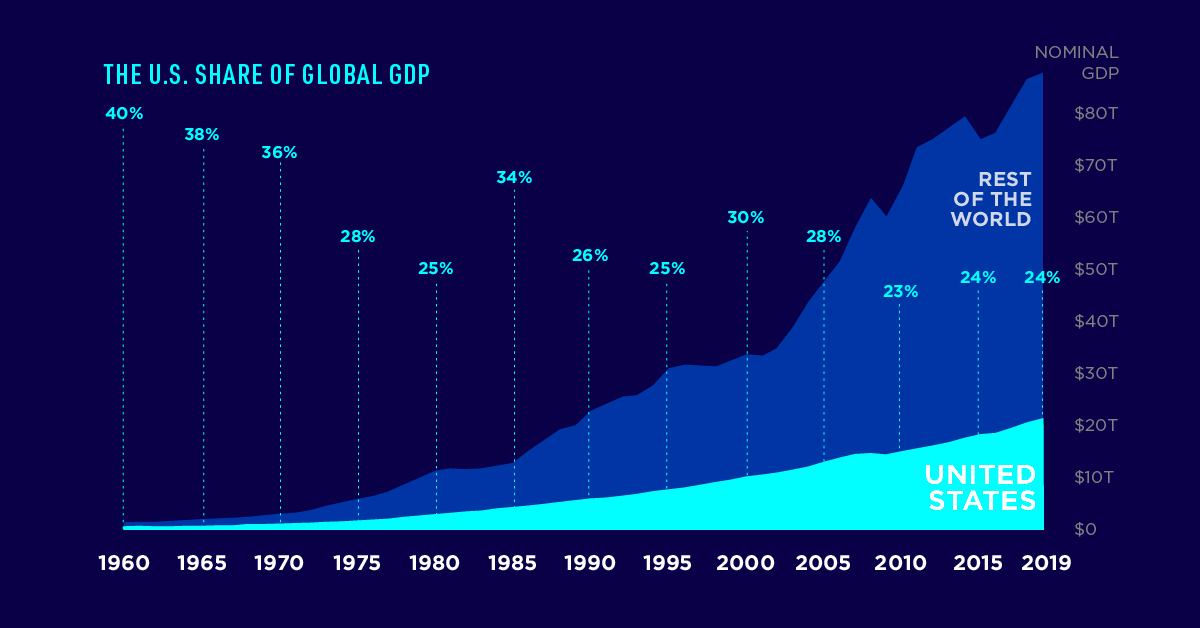
- The U.S. share of the global economy has nearly halved since 1960
- America’s nominal GDP in current U.S. dollars is $21.4 trillion, or about 24% of the share of the global economy
The World’s Largest Economy
The U.S. is the world’s largest economy by nominal GDP, and its influence on the global economy is quite remarkable.
As of 2019, the U.S. made up almost a quarter of the global economy. But how has America’s share of the economic pie changed over time?
The U.S. Share of the Global Economy Over Time
While the U.S. economy has grown quickly over time, the global economy has grown quicker.
Since peaking at 40% in 1960, the U.S. share of the world economy has been cut almost in half, despite a rising national GDP and being the birthplace of some of the biggest companies on the planet.
| Year | Global GDP | U.S. GDP | U.S. Share of Global Economy |
|---|---|---|---|
| 1960 | $1.37T | $0.53T | 40% |
| 1965 | $1.97T | $0.74T | 38% |
| 1970 | $2.96T | $1.07T | 36% |
| 1975 | $5.92T | $1.69T | 28% |
| 1980 | $11.23T | $2.86T | 25% |
| 1985 | $12.79T | $4.34T | 34% |
| 1990 | $22.63T | $5.96T | 26% |
| 1995 | $30.89T | $7.64T | 25% |
| 2000 | $33.62T | $10.25T | 30% |
| 2005 | $47.53T | $13.04T | 28% |
| 2010 | $66.13T | $14.99T | 23% |
| 2015 | $75.22T | $18.23T | 24% |
| 2019 | $87.80T | $21.43T | 24% |
The decline of America’s contribution to global GDP has been slow and uneven, with crests and troughs along the way.
Between 1965 and 1980, the country’s share fell by 13 percentage points, mainly due to stagflation of the 1970s. This decline was followed by Reaganomics and a period of strong recovery, which helped propel the U.S. share of the global economy back up to 34% by 1985.
The whipsawing would continue. Between 1985 and 1995, the U.S share fell by another 11 percentage points, only to bounce back to a local peak of 30% by the year 2000.
Downhill From Here?
Since the beginning of the 21st century, growth in many developing markets has continued at a rapid pace—and the U.S. share of the global economy has decreased as a result.
Until 2005, the U.S. still accounted for 28% of global GDP, but the Global Financial Crisis left a big dent, and its share fell to 23% by 2010. It has since remained relatively stable at 24%.
It’s important to put this decline into perspective. For instance, China’s share of the global economy grew from 4% in 1960 to 16.3% in 2019. Over that same time period, other countries like South Korea, Brazil, Mexico, Indonesia, and India also saw their emergence on the economic world stage, as well.
What the Future Holds
The COVID-19 pandemic has changed the course of the global economy, with most countries experiencing a recession in 2020. America’s economic position will depend on how quickly it can recover compared to the rest of the world.
Where does this data come from?
Source: The World Bank
Details: Data is in current U.S. dollars. Dollar figures for GDP are converted from domestic currencies using single year official exchange rates.


Datastream
Charting the Rise of Cross-Border Money Transfers (2015-2023)
With over 280 million immigrants transferring billions of dollars annually, the remittance industry has become more valuable than ever.
The Briefing
- 79% of remittance payments in 2022 were made to low and middle-income countries.
- Borderless, low-cost money transfer services like those provided by Wise can help immigrants support their families.
The Rise of Cross-Border Money Transfers
The remittance industry has experienced consistent growth recently, solidifying its position as a key component of the global financial landscape. Defined as the transfer of money from one country to another, usually to support a dependent, remittances play a pivotal role in providing food, healthcare, and education.
In this graphic, sponsored by Scottish Mortgage, we delve into the growth of the remittance industry, and the key factors propelling its success.
Powered by Immigration
With over 280 million immigrants worldwide, the remittance industry has an important place in our global society.
By exporting billions of dollars annually back to their starting nations, immigrants can greatly improve the livelihoods of their families and communities.
This is particularly true for low and middle-income countries, who in 2022 received, on average, 79% of remittance payments, according to Knomad, an initiative of the World Bank.
| Year | Low/Middle Income (US$ Billion) | World Total (US$ Billion) |
|---|---|---|
| 2015 | $447B | $602B |
| 2016 | $440B | $596B |
| 2017 | $447B | $638B |
| 2018 | $524B | $694B |
| 2019 | $546B | $722B |
| 2020 | $542B | $711B |
| 2021 | $597B | $781B |
| 2022 | $626B | $794B |
| 2023 | $639B | $815B |
India is one of the global leaders in receiving remittance payments. In 2022 alone, over $100 billion in remittances were sent to India, supporting many families.
Enter Wise
As the global remittance industry continues to grow, it is important to acknowledge the role played by innovative money transfer operators like Wise.
With an inclusive, user-centric platform and competitive exchange rates, Wise makes it easy and cost-effective for millions of individuals to send money home, worldwide.
Connection Without Borders
But Wise doesn’t just offer remittance solutions, the company offers a host of account services and a payment infrastructure that has helped over 6.1 million active customers move over $30 billion in the first quarter of 2023 alone.
Want to invest in transformative companies like Wise?
Discover Scottish Mortgage Investment Trust, a portfolio of some of the world’s most exciting growth companies.
-

 Energy4 weeks ago
Life Cycle Emissions: EVs vs. Combustion Engine Vehicles
-

 History2 weeks ago
Vintage Viz: The World’s Rivers and Lakes, Organized Neatly
-

 United States3 weeks ago
Visualized: The 100 Largest U.S. Banks by Consolidated Assets
-

 AI1 week ago
Charted: Changing Sentiments Towards AI in the Workplace
-

 VC+3 weeks ago
What are Top Investment Managers Holding in Their Portfolios?
-

 Markets1 week ago
The 50 Best One-Year Returns on the S&P 500 (1980-2022)
-

 United States3 weeks ago
Chart: U.S. Home Price Growth Over 50 Years
-

 United States1 week ago
Mapped: The Most Dangerous Cities in the U.S.