Datastream
One Year In: Air Travel Plummeted During the COVID-19 Pandemic


The Briefing
- In the spring of 2020, two-thirds of the world’s passenger jets were grounded
- Lockdowns and travel restrictions have had a significant impact on commercial air travel—for 2020, the industry reported an estimated net loss of $118.5 billion
One Year In: Air Travel Plummeted during COVID-19 Pandemic
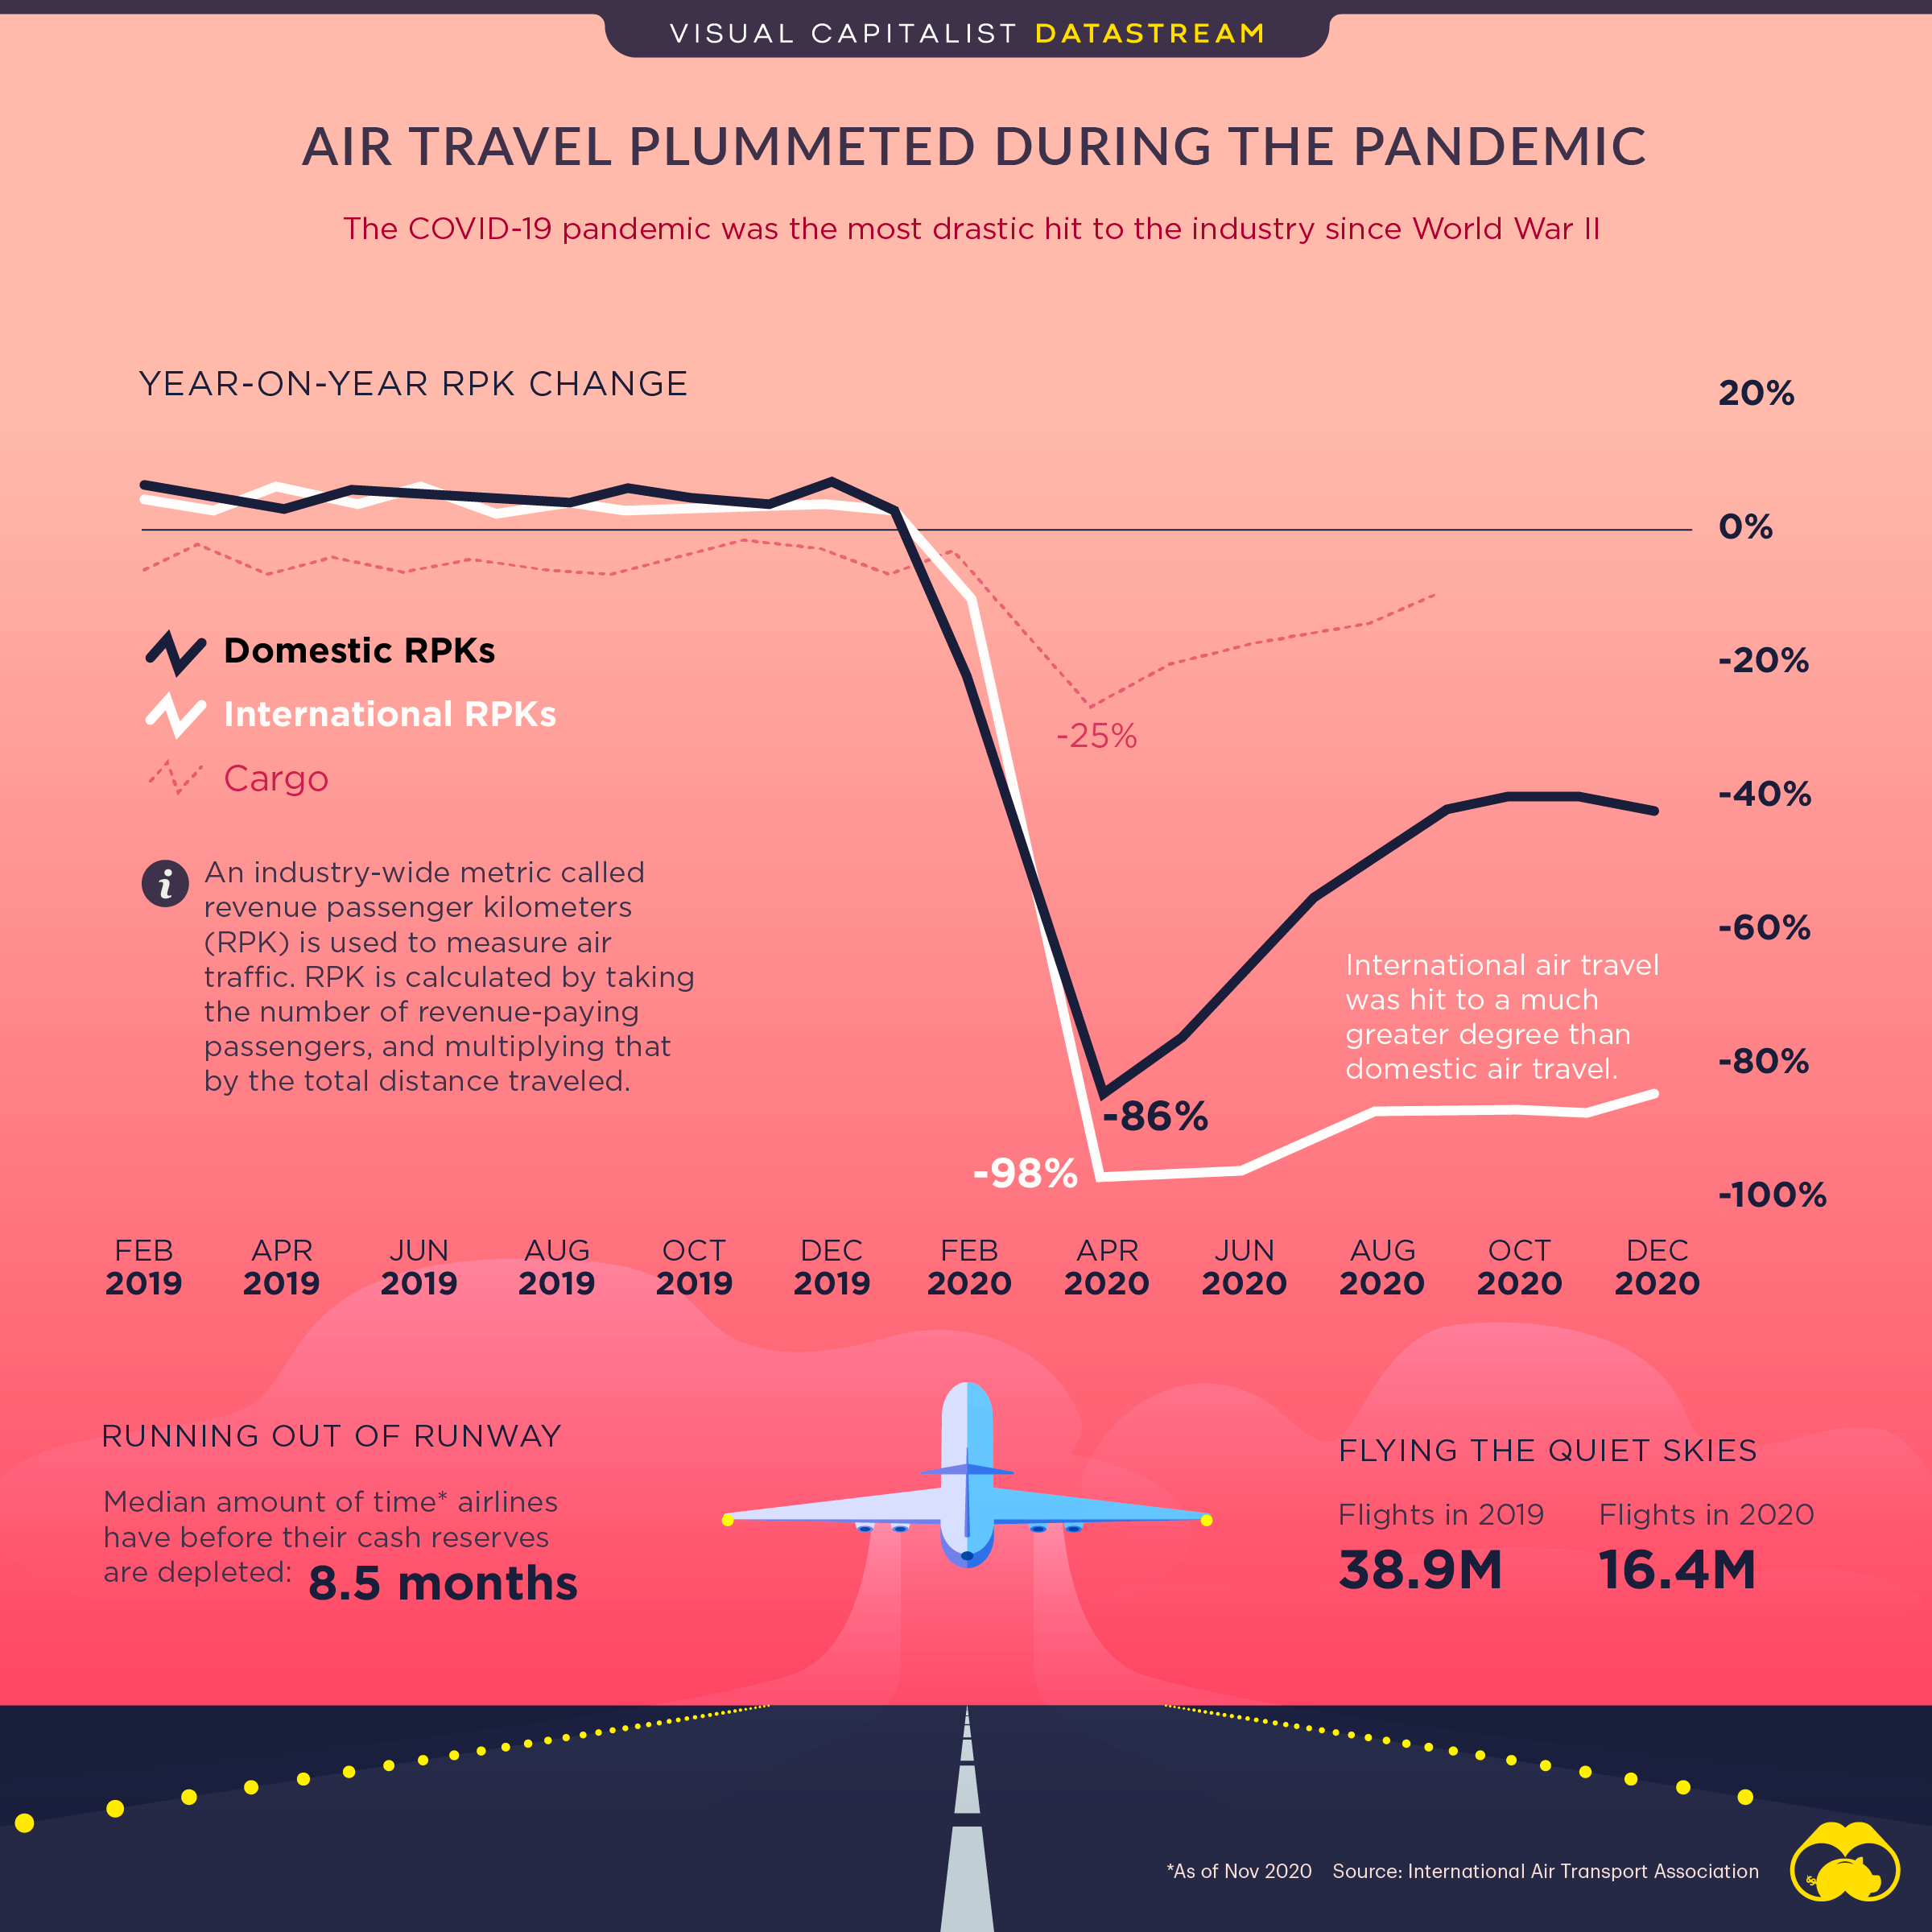
It’s no surprise that the commercial air travel industry took a hit in 2020, given the pandemic-induced travel restrictions that began early last year.
However, it’s worth noting the sheer magnitude of the situation—according to IATA, COVID-19 was the most drastic hit to the industry since World War II.
Low Air Travel, Steep Losses
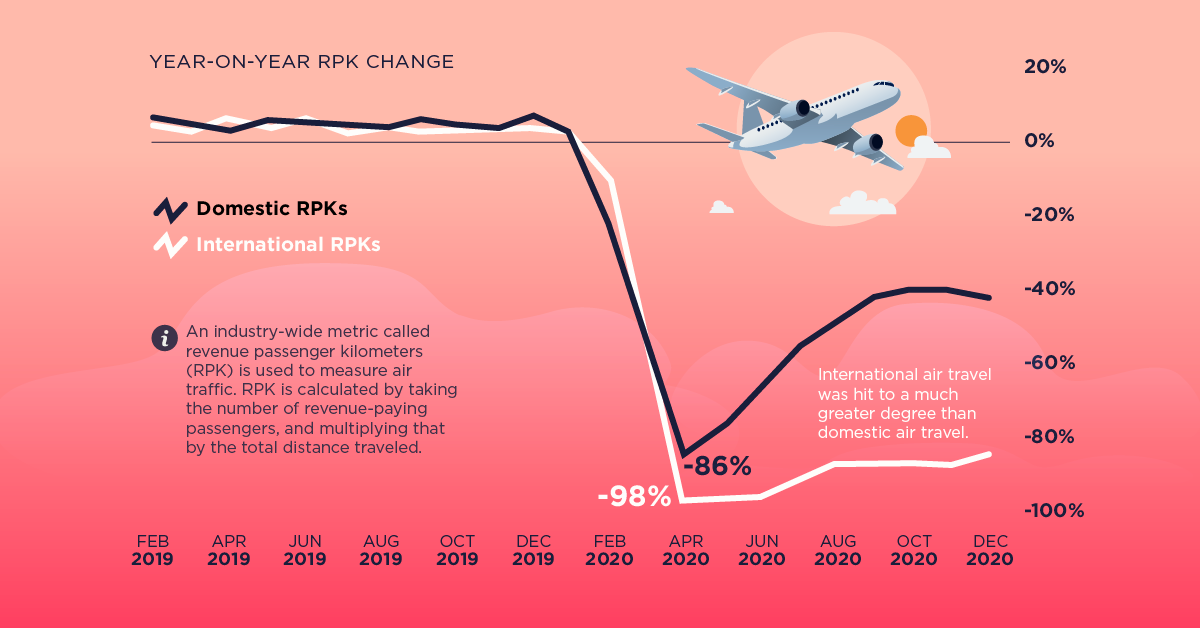
To measure air traffic, IATA uses the industry-wide metric revenue passenger kilometers (RPK). RPK is calculated by taking the number of revenue-paying passengers, and multiplying that by the total distance traveled.
In 2020 as a whole, RPK dropped by 66%—the steepest yearly decline in aviation history. As a result, the global aviation industry reported an estimated net loss of $118.5 billion.
International vs. Domestic
International air travel was hit a lot harder than domestic travel—in 2020, RPK for the worldwide international market fell 75.6%. In April, when strict lockdowns limited travel the most, international RPK was down 98% year-over-year.
In contrast, domestic only dropped by 48.8% in 2020 as a whole.
In terms of regional markets, Asia Pacific saw the largest decrease in RPK, with a decrease of more than 80%.
| International Market | RPK for 2020 (% year-on-year) |
|---|---|
| Africa | -69.8% |
| Asia Pacific | -80.3% |
| Europe | -73.7% |
| Latin America | -71.8% |
| Middle East | -72.9% |
| North America | -75.4% |
On the domestic side of things, Australia saw one of the steepest drops in RPK, at 69.5%. This makes sense, given the country’s relatively strict COVID-19 restrictions and regional lockdowns.
| Domestic Market | RPK for 2020 (% year-on-year) |
|---|---|
| 🇦🇺 Australia | -69.5% |
| 🇧🇷 Brazil | -49.0% |
| 🇨🇳 China | -30.8% |
| 🇮🇳 India | -55.6% |
| 🇯🇵 Japan | -53.6% |
| 🇷🇺 Russia | -23.5% |
| 🇺🇲 U.S. | -59.6% |
Note: These domestic passenger markets accounted for 46% of global total RPKs and approximately 84% of total domestic RPKs in 2020
The Future Looks Bright
While 2020 was a tough year, the future of aviation looks promising.
For example, China’s domestic market showed a negative correlation between new COVID-cases and RPK. When cases were down, RPK increased drastically, showing that there’s pent-up demand.
So once the virus is eradicated and restrictions are lifted, IATA expects flight activity worldwide to bounce back, as they did in China.
» Want to learn more? Check out our COVID-19 information hub to help put the past year into perspective
Where does this data come from?
Source: IATA December 2020 Report


Datastream
Can You Calculate Your Daily Carbon Footprint?
Discover how the average person’s carbon footprint impacts the environment and learn how carbon credits can offset your carbon footprint.


The Briefing
- A person’s carbon footprint is substantial, with activities such as food consumption creating as much as 4,500 g of CO₂ emissions daily.
- By purchasing carbon credits from Carbon Streaming Corporation, you can offset your own emissions and fund positive climate action.
Your Everyday Carbon Footprint
While many large businesses and countries have committed to net-zero goals, it is essential to acknowledge that your everyday activities also contribute to global emissions.
In this graphic, sponsored by Carbon Streaming Corporation, we will explore how the choices we make and the products we use have a profound impact on our carbon footprint.
Carbon Emissions by Activity
Here are some of the daily activities and products of the average person and their carbon footprint, according to Clever Carbon.
| Household Activities & Products | CO2 Emissions (g) |
|---|---|
| 💡 Standard Light Bulb (100 watts, four hours) | 172 g |
| 📱 Mobile Phone Use (195 minutes per day)* | 189 g |
| 👕 Washing Machine (0.63 kWh) | 275 g |
| 🔥 Electric Oven (1.56 kWh) | 675 g |
| ♨️ Tumble Dryer (2.5 kWh) | 1,000 g |
| 🧻 Toilet Roll (2 ply) | 1,300 g |
| 🚿 Hot Shower (10 mins) | 2,000 g |
| 🚙 Daily Commute (one hour, by car) | 3,360 g |
| 🍽️ Average Daily Food Consumption (three meals of 600 calories) | 4,500 g |
| *Phone use based on yearly use of 69kg per the source, Reboxed | |
Your choice of transportation plays a crucial role in determining your carbon footprint. For instance, a 15 km daily commute to work on public transport generates an average of 1,464 g of CO₂ emissions. Compared to 3,360 g—twice the volume for a journey the same length by car.
By opting for more sustainable modes of transport, such as cycling, walking, or public transportation, you can significantly reduce your carbon footprint.
Addressing Your Carbon Footprint
One way to compensate for your emissions is by purchasing high-quality carbon credits.
Carbon credits are used to help fund projects that avoid, reduce or remove CO₂ emissions. This includes nature-based solutions such as reforestation and improved forest management, or technology-based solutions such as the production of biochar and carbon capture and storage (CCS).
While carbon credits offer a potential solution for individuals to help reduce global emissions, public awareness remains a significant challenge. A BCG-Patch survey revealed that only 34% of U.S. consumers are familiar with carbon credits, and only 3% have purchased them in the past.
About Carbon Streaming
By financing the creation or expansion of carbon projects, Carbon Streaming Corporation secures the rights to future carbon credits generated by these sustainable projects. You can then purchase these carbon credits to help fund climate solutions around the world and compensate for your own emissions.
Ready to get involved?
>> Learn more about purchasing carbon credits at Carbon Streaming
-

 Public Opinion18 hours ago
How Do Chinese Citizens Feel About Other Countries?
-

 Markets4 weeks ago
Visualizing Every Company on the S&P 500 Index
-

 Markets2 weeks ago
Visualizing 1 Billion Square Feet of Empty Office Space
-

 Energy4 weeks ago
Life Cycle Emissions: EVs vs. Combustion Engine Vehicles
-

 History2 weeks ago
Vintage Viz: The World’s Rivers and Lakes, Organized Neatly
-

 Markets3 weeks ago
Visualized: The 100 Largest U.S. Banks by Consolidated Assets
-

 Jobs1 week ago
Charted: Changing Sentiments Towards AI in the Workplace
-

 Markets3 weeks ago
What are Top Investment Managers Holding in Their Portfolios?