Markets
Charted: Top Destinations for Africa’s Exports (1995-2020)
Article/Editing:
![]() Winner of the 2023 Creator Program Challenge.
Winner of the 2023 Creator Program Challenge.
Click to view this graphic in a higher-resolution
Charted: Top Destinations for Africa’s Exports (1995-2020)
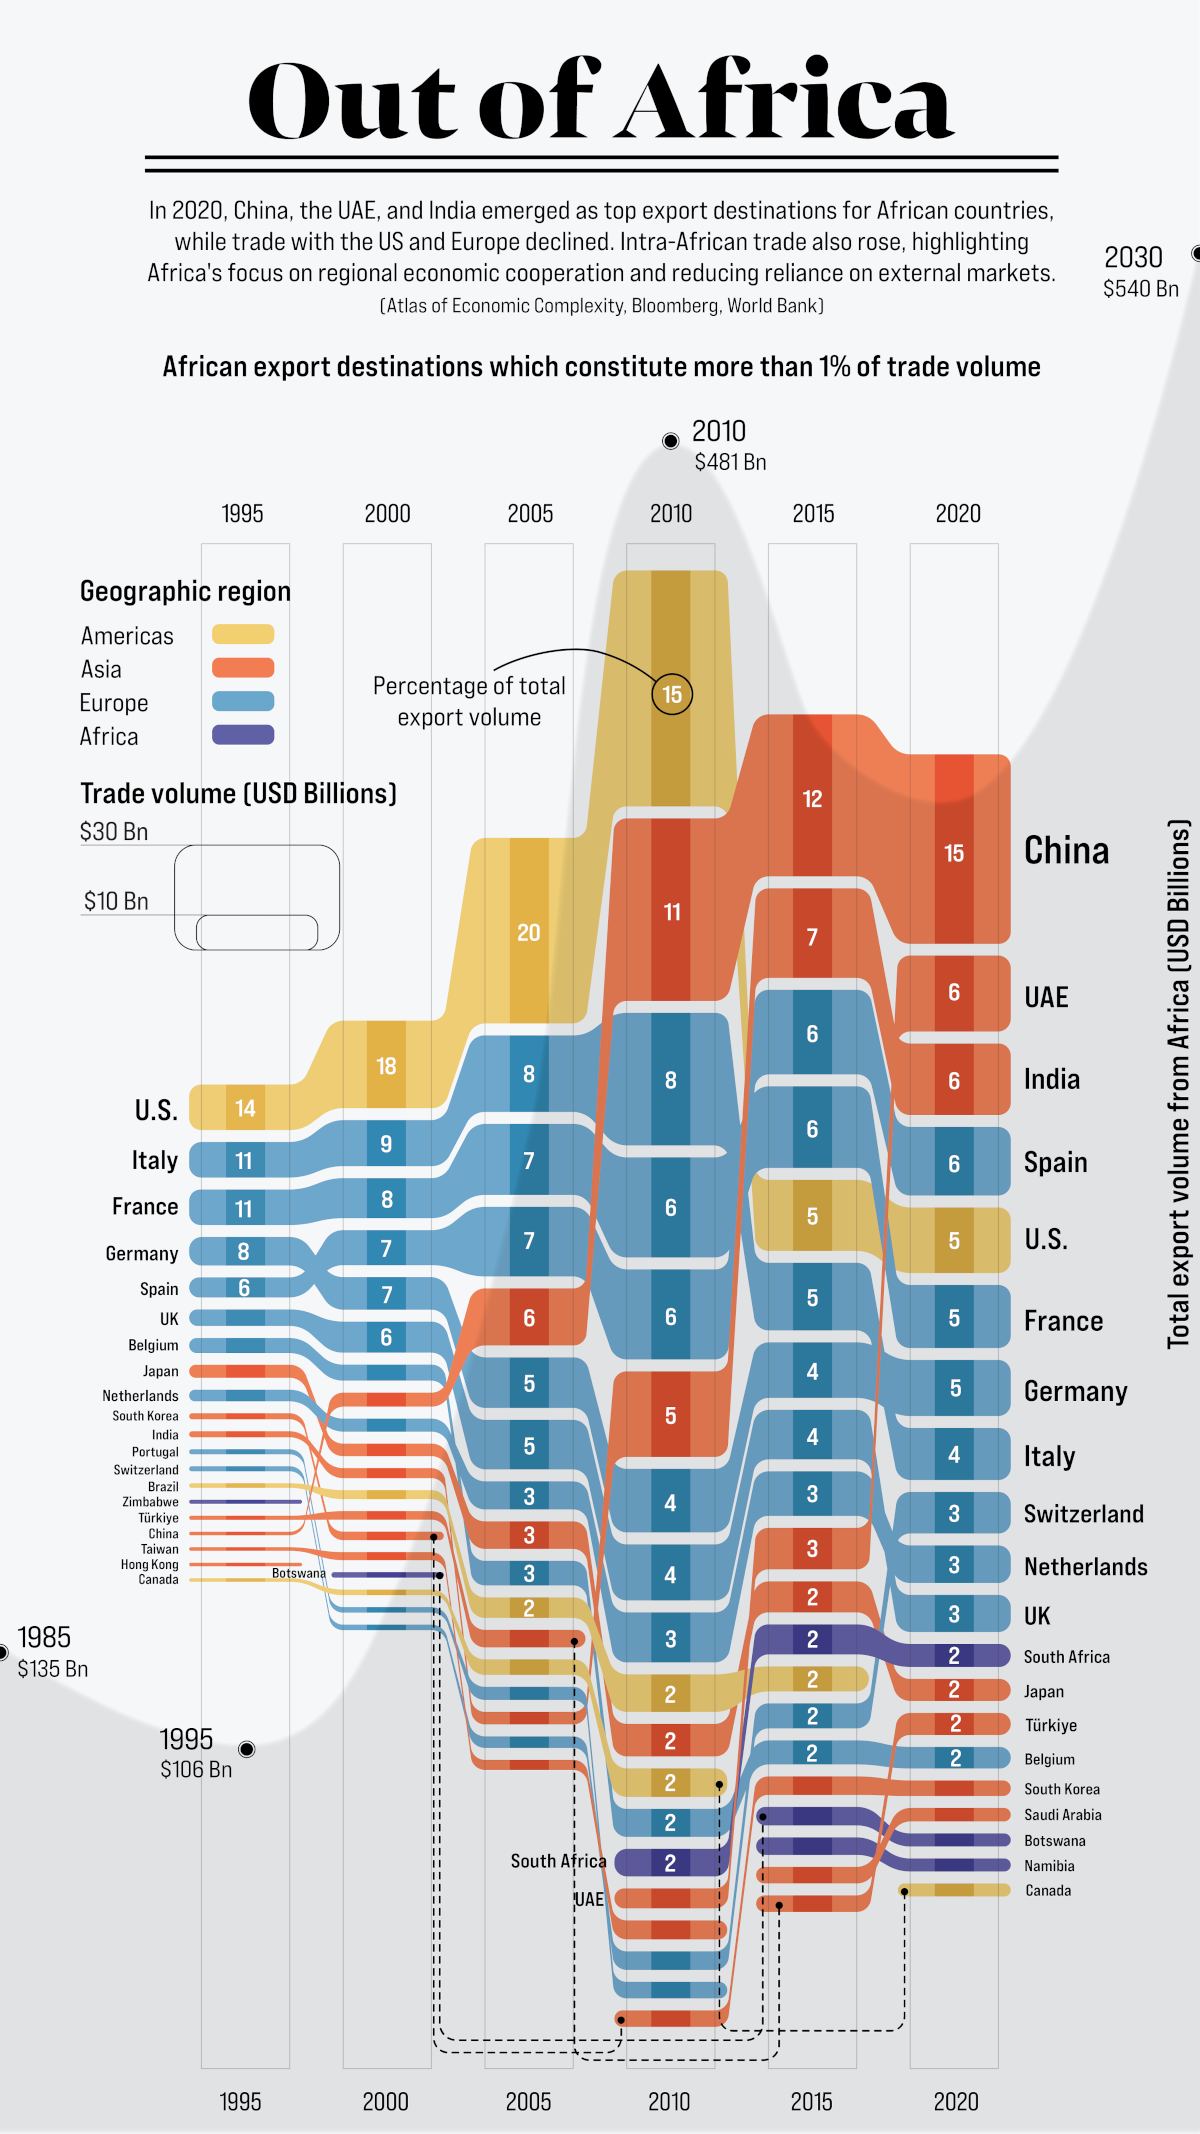
Just under 30 years ago, exports originating from countries in Africa sat at $106 billion annually, primarily going to nations in the West. By 2020, Africa’s exports had more than tripled, but now with Asia as the primary destination.
The world’s second-largest continent, much of the value of Africa’s exports are concentrated in natural resources like petroleum, gold, diamonds, natural gas, and coal. Agricultural commodities like tea, coffee, and cotton also find large markets overseas.
Which countries are the top destinations for Africa’s exports?
This graphic from Sebastian Gräff uses data from Harvard University’s Atlas of Economic Complexity, the World Bank, and Bloomberg to track total exports from African countries over the years. Countries receiving a 1% or greater share of total exports have been included, and percentages have been rounded.
Tracking Africa’s Exports Between 1995 and 2005
The U.S. was the top destination for African goods for many years, led by the country’s demand for petroleum products. At its peak in 2005, the U.S. received one-fifth of the continent’s exports, valued at $55 billion.
Here’s a look at all the countries that had a 1% or greater share of Africa’s total export value at some point from 1995 to 2005.
| Country | Region | 1995 | 2000 | 2005 |
|---|---|---|---|---|
| 🇺🇸 U.S. | North America | 14% | 18% | 20% |
| 🇮🇹 Italy | Europe | 11% | 9% | 8% |
| 🇫🇷 France | Europe | 11% | 8% | 7% |
| 🇩🇪 Germany | Europe | 8% | 7% | 5% |
| 🇪🇸 Spain | Europe | 6% | 7% | 7% |
| 🇬🇧 UK | Europe | 5% | 6% | 5% |
| 🇧🇪 Belgium | Europe | 5% | 3% | 3% |
| 🇯🇵 Japan | Asia | 4% | 3% | 3% |
| 🇳🇱 Netherlands | Europe | 3% | 3% | 3% |
| 🇰🇷 South Korea | Asia | 2% | 2% | 1% |
| 🇮🇳 India | Asia | 2% | 2% | 1% |
| 🇵🇹 Portugal | Europe | 2% | 1% | 1% |
| 🇨🇳 China | Asia | 1% | 3% | 6% |
| 🇧🇷 Brazil | South America | 1% | 2% | 2% |
| 🇹🇷 Turkiye | Asia | 1% | 2% | 2% |
| 🇨🇦 Canada | North America | 1% | 1% | 2% |
| 🇨🇭 Switzerland | Europe | 1% | 1% | 1% |
| 🇿🇼 Zimbabwe | Africa | 1% | 1% | 1% |
| 🇹🇼 Taiwan | Asia | 1% | 2% | 1% |
| 🇸🇦 Saudi Arabia | Asia | 1% | 1% | 1% |
| 🇿🇦 South Africa | Africa | 1% | 0% | 1% |
| 🇨🇮 Côte d'Ivoire | Africa | 1% | 1% | 1% |
| 🇭🇰 Hong Kong | Asia | 1% | 0% | 0% |
| 🇦🇹 Austria | Europe | 1% | 0% | 0% |
| 🇬🇷 Greece | Europe | 1% | 1% | 0% |
| 🇹🇭 Thailand | Asia | 1% | 0% | 0% |
| 🇸🇬 Singapore | Asia | 1% | 0% | 0% |
| 🇲🇿 Mozambique | Africa | 1% | 1% | 0% |
| 🇹🇳 Tunisia | Africa | 1% | 0% | 0% |
| 🇮🇩 Indonesia | Asia | 1% | 1% | 0% |
| 🇳🇬 Nigeria | Africa | 0% | 0% | 1% |
| 🇦🇺 Australia | Oceania | 0% | 0% | 1% |
| 🇧🇼 Botswana | Africa | N/A | 1% | 1% |
| 🇳🇦 Namibia | Africa | N/A | 1% | 1% |
| 🇸🇿 Eswatini | Africa | N/A | 1% | 0% |
| 🇿🇲 Zambia | Africa | N/A | 1% | 0% |
Western European countries—Italy, France, Spain, Germany, Belgium and the UK—also accounted for a significant share of Africa’s exports throughout this time period. Part of this was due to century-old relationships and colonial legacies, but trade was also encouraged by initiatives like the 1976 Lomé Convention, which gave products from developing African countries (particularly former colonies) duty-free access to European markets in exchange for developmental aid.
During the mid-2000s, China also started to take up a growing share of the continent’s exports, as its rapid industrialization led to skyrocketing demand for commodities such as oil, iron ore, and copper—all key African exports.
Asia’s Growing Export Share Between 2010 and 2020
By the year 2010, as African exports topped the $481 billion per year mark, the global market was rapidly starting to change.
For starters, thanks to a considerable increase in domestic oil and natural gas production, the United States began cutting back on African petroleum imports.
At the same time, China had been actively seeking resources and investment opportunities in the developing world as part of its greater geopolitical strategy. By 2015, it had surpassed the U.S. as Africa’s primary export destination, marking a shift in the continent’s trade dynamics.
Here’s a look at all the countries with a 1% or greater share of Africa’s total export value from 2010 to 2020.
| Country | Region | 2010 | 2015 | 2020 |
|---|---|---|---|---|
| 🇺🇸 U.S. | North America | 15% | 5% | 5% |
| 🇨🇳 China | Asia | 11% | 12% | 15% |
| 🇮🇹 Italy | Europe | 8% | 5% | 4% |
| 🇪🇸 Spain | Europe | 6% | 6% | 6% |
| 🇫🇷 France | Europe | 6% | 6% | 5% |
| 🇮🇳 India | Asia | 5% | 7% | 6% |
| 🇩🇪 Germany | Europe | 4% | 4% | 5% |
| 🇬🇧 UK | Europe | 4% | 4% | 3% |
| 🇳🇱 Netherlands | Europe | 3% | 3% | 3% |
| 🇯🇵 Japan | Asia | 2% | 2% | 2% |
| 🇧🇪 Belgium | Europe | 2% | 2% | 2% |
| 🇿🇦 South Africa | Africa | 2% | 2% | 2% |
| 🇧🇷 Brazil | South America | 2% | 2% | 1% |
| 🇨🇦 Canada | North America | 2% | 1% | 1% |
| 🇦🇪 UAE | Asia | 1% | 3% | 6% |
| 🇨🇭 Switzerland | Europe | 1% | 2% | 3% |
| 🇹🇷 Turkiye | Asia | 1% | 1% | 2% |
| 🇵🇹 Portugal | Europe | 1% | 1% | 1% |
| 🇰🇷 South Korea | Asia | 1% | 1% | 1% |
| 🇧🇼 Botswana | Africa | 1% | 1% | 1% |
| 🇳🇦 Namibia | Africa | 1% | 1% | 1% |
| 🇿🇲 Zambia | Africa | 1% | 1% | 1% |
| 🇸🇦 Saudi Arabia | Asia | 1% | 1% | 1% |
| 🇬🇷 Greece | Europe | 1% | 0% | 1% |
| 🇦🇺 Australia | Oceania | 1% | 0% | 1% |
| 🇿🇼 Zimbabwe | Africa | 1% | 1% | 1% |
| 🇲🇾 Malaysia | Asia | 1% | 1% | 1% |
| 🇨🇩 DRC | Africa | 1% | 1% | 1% |
| 🇹🇼 Taiwan | Asia | 1% | 1% | 0% |
| 🇳🇬 Nigeria | Africa | 1% | 1% | 0% |
| 🇨🇮 Côte d'Ivoire | Africa | 1% | 1% | 0% |
| 🇮🇩 Indonesia | Asia | 0% | 1% | 1% |
| 🇲🇿 Mozambique | Africa | 0% | 1% | 1% |
| 🇭🇰 Hong Kong | Asia | 0% | 1% | 1% |
| 🇸🇬 Singapore | Asia | 0% | 0% | 1% |
| 🇹🇭 Thailand | Asia | 0% | 0% | 1% |
| 🇻🇳 Vietnam | Asia | 0% | 0% | 1% |
| 🇷🇺 Russia | Europe | 0% | 0% | 1% |
| 🇵🇰 Pakistan | Asia | 0% | 0% | 1% |
| 🇵🇱 Poland | Europe | 0% | 0% | 1% |
| 🇺🇬 Uganda | Asia | 0% | 0% | 1% |
China was joined in the top three ranks by India and the UAE, who were also experiencing rapid industrialization and growing demand for African commodities. In 2020, nearly 40% of Africa’s exports found a market in Asia, led by China and India’s significant trade volumes.
In comparison, Western Europe had started relinquish both its share and value of African goods imported. Alongside growing demand from developing countries, there became greater diversification in African export markets, with countries from Asia (Malaysia, Pakistan), Eastern Europe (Poland, Russia), and within Africa (the Democratic Republic of the Congo, Uganda), accounting for growing shares of African exports.
The Future of the African Export Market
Though Africa’s largest export markets are outside the continent for now, there is vast untapped potential for inter-regional exports, which stood at only 15% of total export value in 2020.
There is movement to expand on this trade, with the African Continental Free Trade Area (AfCFTA) established in 2018 to reduce trade barriers between African countries. According to UN estimates, it has the potential to create a $3 trillion market within the continent alone.
With one of the fastest-growing regional populations, the African continent’s economic stakes have never been higher. So who will end up dominating Africa’s trade landscape in the decades to come?
 |
WINNER: The 2023 Creator Program Challenge
Winners of our Creator Program Challenges receive their own ambassador badge, prize money, and become a trusted creator on Visual Capitalist. For all results from the 2023 Creator Program Challenge, click here to check out the year’s shortlist winners. |

This article was published as a part of Visual Capitalist's Creator Program, which features data-driven visuals from some of our favorite Creators around the world.


Markets
The 50 Best One-Year Returns on the S&P 500 (1980-2022)
The highest one-year return among the top S&P 500 stocks from 1980 to 2022 was a staggering 2,620%. Which stocks top the ranks?

The Top S&P 500 Stocks by Annual Returns
The average annual return of the S&P 500 was 10% from 1980-2022, excluding dividends. Of course, there are some companies that deliver much higher returns in any given year.
In this graphic using data from S&P Dow Jones Indices, we explore the top S&P 500 stocks with the best single year returns over the last four decades.
Ranking the Top S&P 500 Stocks
In order to find the top gainers, S&P took the top 10 best-performing stocks each year and then narrowed that list down to the top 50 overall. They ranked the top S&P 500 stocks by price returns, meaning that no dividends or stock distributions were included.
The best gains were clustered in a few select years, including the 1999 dot-com boom, the 2003 stock market rally, and the 2009 recovery from the Global Financial Crisis. None of the biggest gains happened in 2021 or 2022.
| Rank | Company | Sector | Return | Year |
|---|---|---|---|---|
| 1 | Qualcomm | Information Technology | 2620% | 1999 |
| 2 | Tesla | Consumer Discretionary | 743% | 2020 |
| 3 | DSC Communications | Communication Services | 468% | 1992 |
| 4 | Coleco Industries | Consumer Discretionary | 435% | 1982 |
| 5 | Avaya | Information Technology | 428% | 2003 |
| 6 | Chrysler | Consumer Discretionary | 426% | 1982 |
| 7 | XL Capital (Axa XL) | Financials | 395% | 2009 |
| 8 | Tenet Healthcare | Healthcare | 369% | 2009 |
| 9 | Dynegy | Utilities | 361% | 2000 |
| 10 | Advanced Micro Devices | Information Technology | 348% | 2009 |
| 11 | Sprint | Communication Services | 343% | 1999 |
| 12 | Ford | Consumer Discretionary | 337% | 2009 |
| 13 | NEXTEL Communications | Communication Services | 336% | 1999 |
| 14 | LSI Logic | Information Technology | 319% | 1999 |
| 15 | NVIDIA | Information Technology | 308% | 2001 |
| 16 | Nortel Networks | Communication Services | 304% | 1999 |
| 17 | Etsy | Consumer Discretionary | 302% | 2020 |
| 18 | Genworth Financial | Financials | 301% | 2009 |
| 19 | Micron Technology | Information Technology | 300% | 2009 |
| 20 | NetFlix | Communication Services | 298% | 2013 |
| 21 | Oracle | Information Technology | 290% | 1999 |
| 22 | Western Digital | Information Technology | 286% | 2009 |
| 23 | Network Appliance (NetApp) | Information Technology | 270% | 1999 |
| 24 | Data General | Information Technology | 267% | 1991 |
| 25 | Yahoo | Communication Services | 265% | 1999 |
| 26 | Williams Companies | Energy | 264% | 2003 |
| 27 | Novell | Information Technology | 264% | 1991 |
| 28 | Dynegy | Utilities | 263% | 2003 |
| 29 | Sun Microsystems | Information Technology | 262% | 1999 |
| 30 | PMC-Sierra | Information Technology | 262% | 2003 |
| 31 | Advanced Micro Devices | Information Technology | 259% | 1991 |
| 32 | Dell | Information Technology | 248% | 1998 |
| 33 | Global Marine | Energy | 247% | 1980 |
| 34 | Micron Technology | Information Technology | 243% | 2013 |
| 35 | Best Buy | Consumer Discretionary | 237% | 2013 |
| 36 | Reebok | Consumer Discretionary | 234% | 2000 |
| 37 | Freeport-McMoRan | Materials | 229% | 2009 |
| 38 | Biomet (Zimmer Biomet) | Healthcare | 226% | 1991 |
| 39 | NVIDIA | Information Technology | 224% | 2016 |
| 40 | Gap | Consumer Discretionary | 223% | 1991 |
| 41 | NetFlix | Communication Services | 219% | 2010 |
| 42 | Fleetwood Enterprises (Fleetwood RV) | Consumer Discretionary | 217% | 1982 |
| 43 | National Semiconductor | Information Technology | 217% | 1999 |
| 44 | Dell | Information Technology | 216% | 1997 |
| 45 | Tandy Corp (RadioShack) | Information Technology | 216% | 1980 |
| 46 | Novell | Information Technology | 215% | 2003 |
| 47 | Corning | Information Technology | 215% | 2003 |
| 48 | CB Richard Ellis (CBRE) | Real Estate | 214% | 2009 |
| 49 | AES Corp | Utilities | 213% | 2003 |
| 50 | Expedia | Consumer Discretionary | 212% | 2009 |
Qualcomm was by far the top-performer in any one calendar year window. The company had key patents for Code Division Multiple Access (CDMA) technology, which enabled fast wireless internet access and became the basis for 3G networks.
Its stock took off in 1999 as it shed less profitable business lines, resolved a patent dispute with competitor Ericsson, and joined the S&P 500 Index. At the time, CNN reported that one lucky investor who heard about Qualcomm from an investment-banker-turned-rabbi earned $17 million—roughly $30 million in today’s dollars.
The most recent stocks to make the rankings were both from 2020: well-known Tesla (#2) and lesser-known online marketplace Etsy (#17), which saw sales from independent creators surge during the early COVID-19 pandemic. The dollar value of items sold on Etsy more than doubled from $5.3 billion in 2019 to $10.3 billion in 2020, with mask sales accounting for 7% of the total.
Biggest Gainers in Each Sector
While information technology stocks made up nearly half of the list, there is representation from nine of the 11 S&P 500 sectors. No companies from the Industrials or Consumer Staples sectors made it into the ranks of the top S&P 500 stocks by annual returns.
Below, we show the stock with the best annual return for each sector.

Tesla was the top-performing Consumer Discretionary stock on the list. After meeting the requirement of four consecutive quarters of positive earnings, it joined the S&P 500 Index on December 21, 2020. The company’s performance was boosted by the announcement that it would be included in the S&P 500, along with strong performance in China, and general EV buzz as environmental regulations tightened worldwide.
In the realm of Communication Services, DSC Communications saw a sizable return in 1992. The telecommunications equipment company had contracts with major companies such as Bell and Motorola. Alcatel-Lucent (then Alcatel), a French producer of mobile phones, purchased DSC Communications in 1998.
Serial Success Stories
It’s impressive to make the list of the top S&P 500 stocks by calendar returns once, but there are seven companies that have done it twice.
Some stocks saw their repeated outperformance close together, with Dell making the ranks back-to-back in 1997 and 1998.

On the other hand, a select few have more staying power. Computing giant NVIDIA topped the charts in 2001 and triumphed again 15 years later in 2016. And this year might be another win, as the company has recently reached a $1 trillion market capitalization and has the highest year-to-date return in the S&P 500 as of July 6, 2023.
-

 Markets4 weeks ago
The World’s Biggest Mutual Fund and ETF Providers
-

 Markets2 weeks ago
Brand Reputations: Ranking the Best and Worst in 2023
-

 Environment5 days ago
Hotter Than Ever: 2023 Sets New Global Temperature Records
-

 Datastream4 weeks ago
Can You Calculate Your Daily Carbon Footprint?
-

 Energy2 weeks ago
Who’s Still Buying Russian Fossil Fuels in 2023?
-

 VC+4 days ago
What’s New on VC+ in July
-

 Investor Education4 weeks ago
Visualizing BlackRock’s Top Equity Holdings
-

 Technology2 weeks ago
Meet the Competing Apps Battling for Twitter’s Market Share