Markets
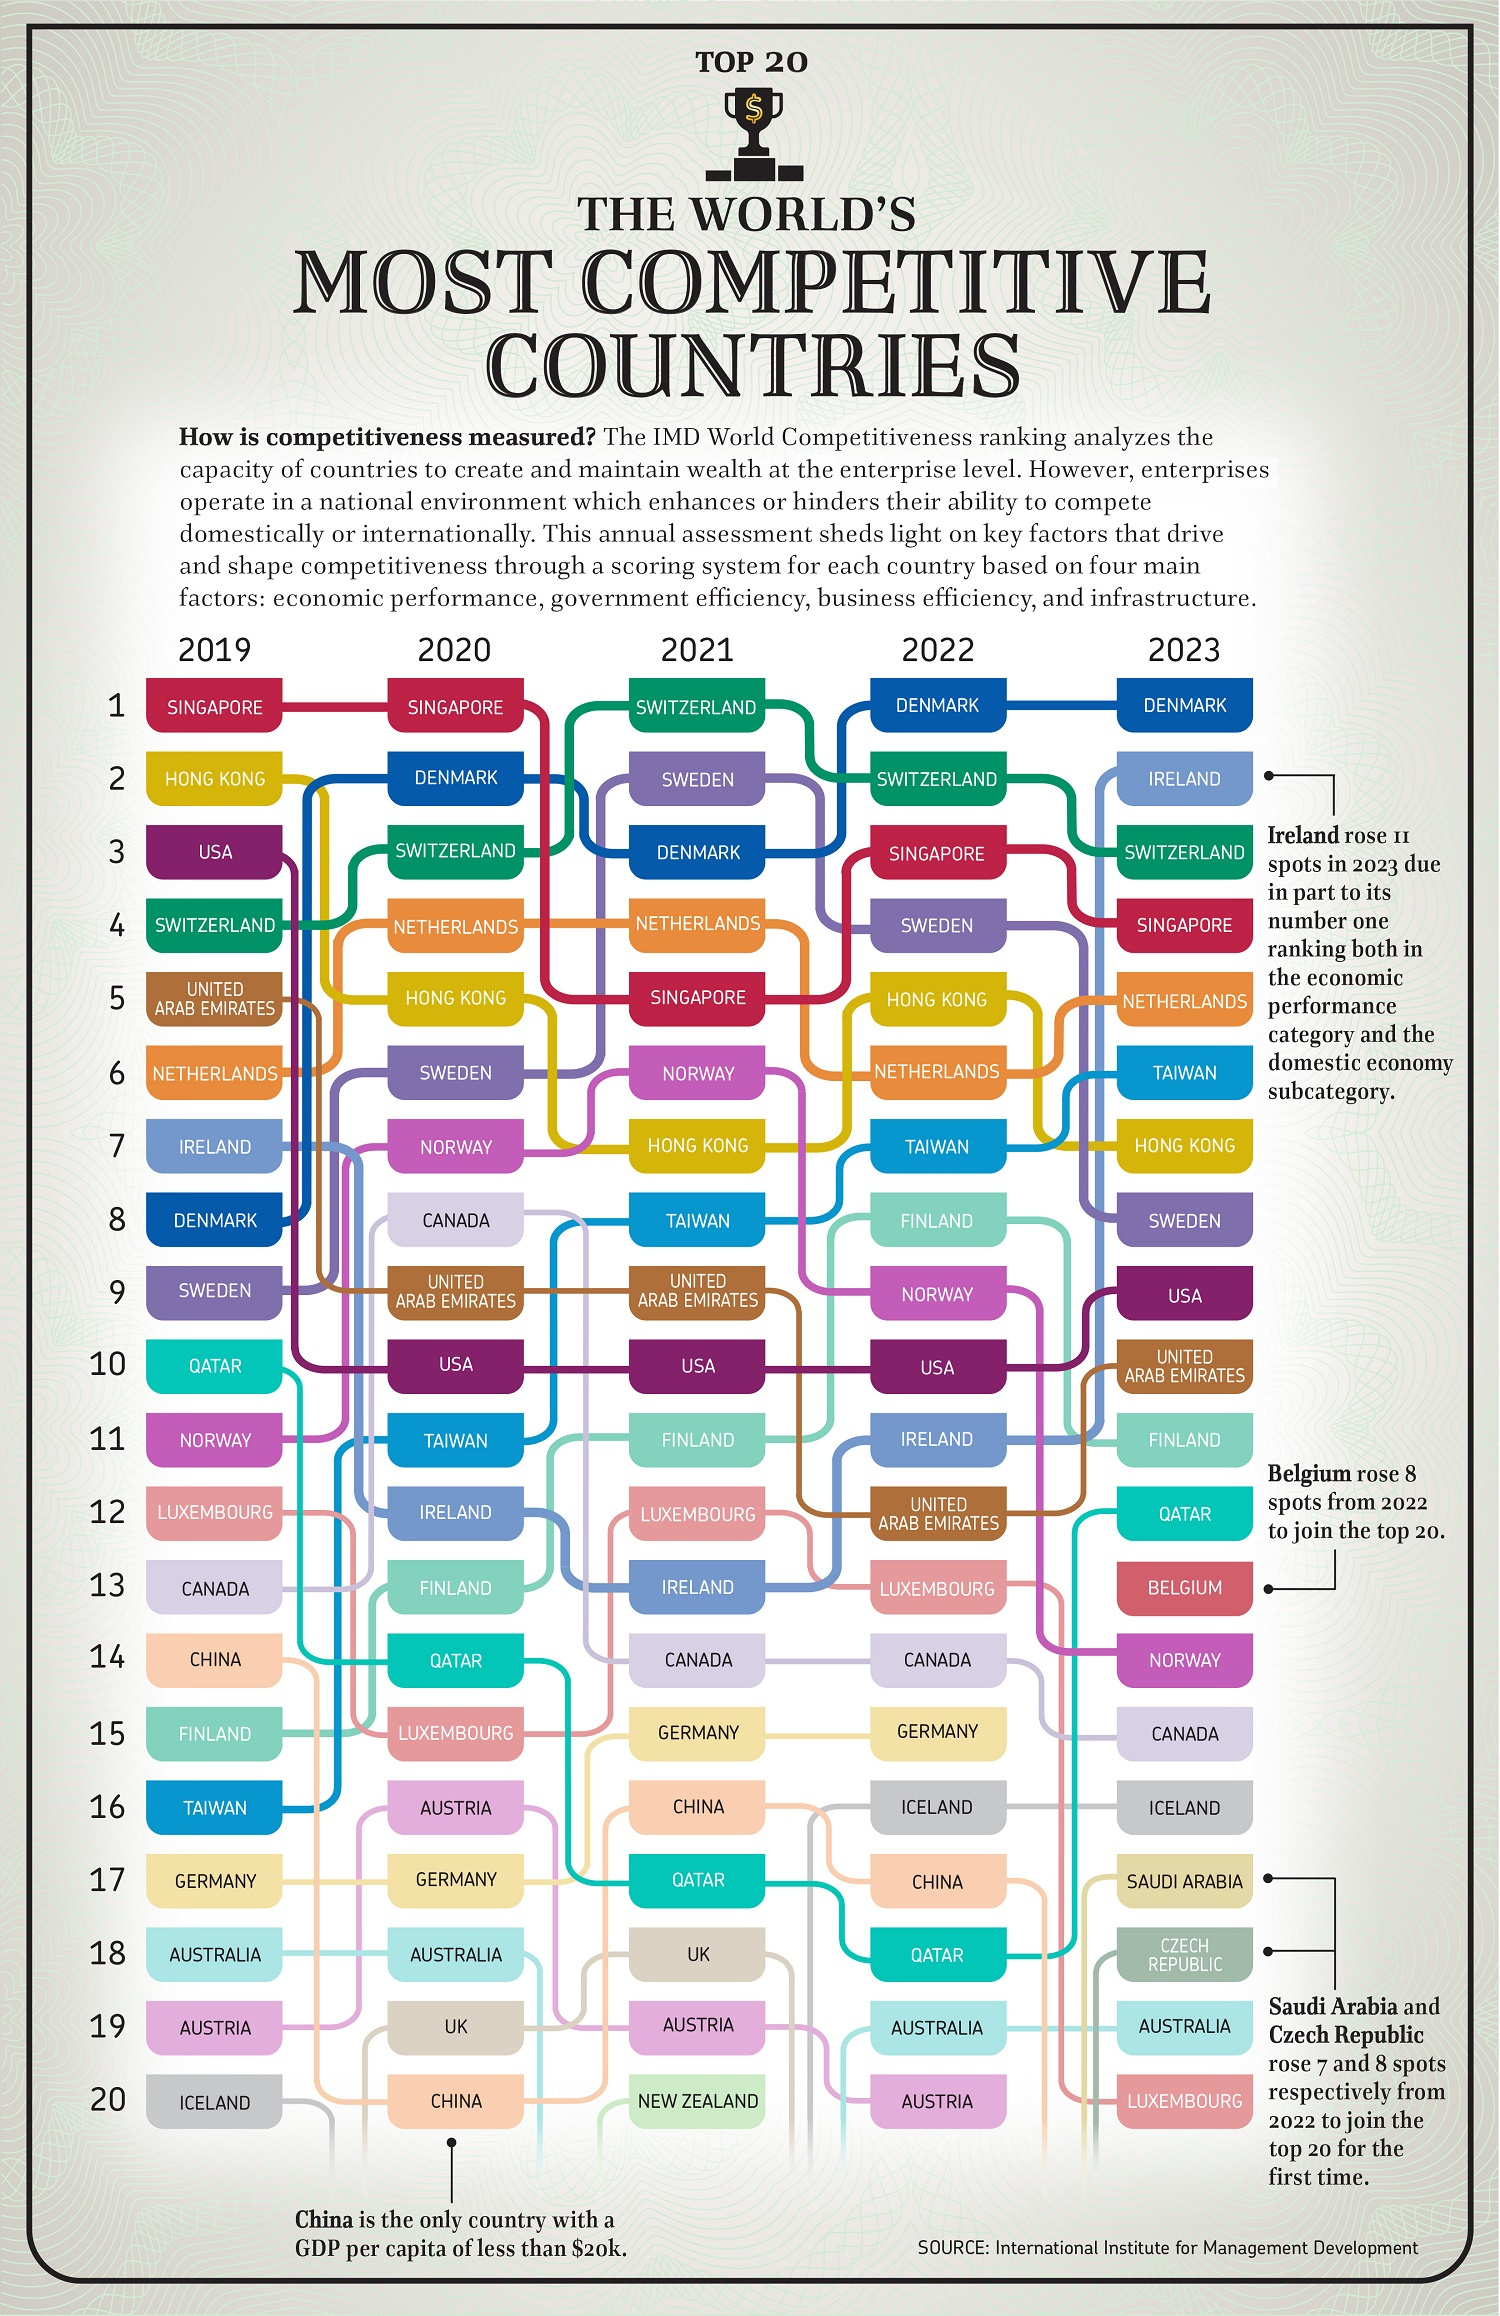
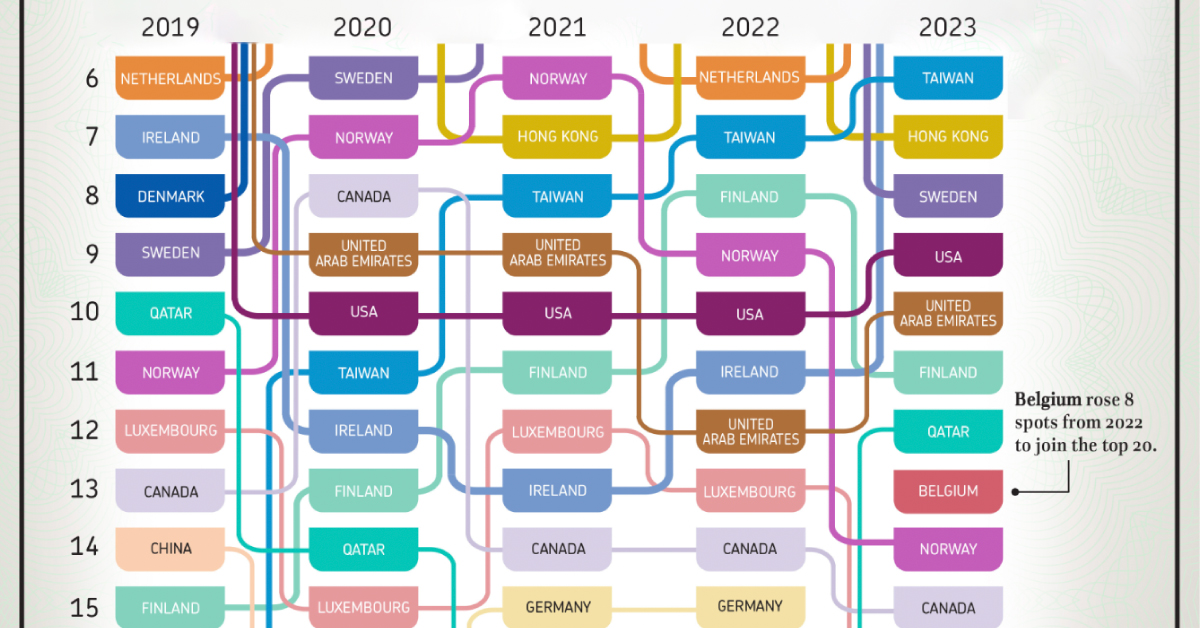
Ranked: The World’s Most Competitive Countries (2019-2023)
Article/Editing:
Ranking the Most Competitive Countries Around the World
Just as a well-made ship needs fair weather for a smooth voyage, businesses need a supportive ecosystem to start and stay successful.
Rankings for the most competitive countries attempt to quantify this support directly, seeing which economies have the best frameworks for business to thrive. Examining how the rankings change over time can also tell us a lot about how countries are progressing relative to others.
In the above graphic, Julie Peasley uses the World Competitiveness Ranking report by the International Institute for Management Development (IMD) to chart the top 20 most competitive countries between 2019 and 2023.
How is Business Competitiveness Measured?
IMD examines countries on the basis of four metrics across multiple sub-factors:
- Economic performance:
Domestic economy, international trade, international investment, employment, prices - Government efficiency:
Public finance, tax policy, institutional framework, business legislation, societal framework - Business efficiency:
Productivity & efficiency, labor market, finance, management practices, attitudes & values - Infrastructure:
Basic infrastructure, technological infrastructure, scientific infrastructure, health & environment, education
These metrics are scored on a mix of hard statistics, surveys from partner institutes, and supplementary data.
Which Countries are the Best and Worst for Business?
Denmark holds on to the top spot as the most business-friendly country in 2023, after it ranked number one for the first time in 2022. The Scandinavian country has been a perennial top 10 performer since 2018 but really began its ascent to the summit in the last four years.
The country excels in the categories of business efficiency, government efficiency, and infrastructure metrics, despite comparatively average economic performance next to some of its geographic peers.
| Rank (2023) | Country | 2019 | 2020 | 2021 | 2022 |
|---|---|---|---|---|---|
| 1 | 🇩🇰 Denmark | 8 | 2 | 3 | 1 |
| 2 | 🇮🇪 Ireland | 7 | 12 | 13 | 11 |
| 3 | 🇨🇭 Switzerland | 4 | 3 | 1 | 2 |
| 4 | 🇸🇬 Singapore | 1 | 1 | 5 | 3 |
| 5 | 🇳🇱 Netherlands | 6 | 4 | 4 | 6 |
| 6 | 🇹🇼 Taiwan | 16 | 11 | 8 | 7 |
| 7 | 🇭🇰 Hong Kong | 2 | 5 | 7 | 5 |
| 8 | 🇸🇪 Sweden | 9 | 6 | 2 | 4 |
| 9 | 🇺🇸 U.S. | 3 | 10 | 10 | 10 |
| 10 | 🇦🇪 UAE | 5 | 9 | 9 | 12 |
| 11 | 🇫🇮 Finland | 15 | 13 | 11 | 8 |
| 12 | 🇶🇦 Qatar | 10 | 14 | 17 | 18 |
| 13 | 🇧🇪 Belgium | 27 | 25 | 24 | 21 |
| 14 | 🇳🇴 Norway | 11 | 7 | 6 | 9 |
| 15 | 🇨🇦 Canada | 13 | 8 | 14 | 14 |
| 16 | 🇮🇸 Iceland | 20 | 21 | 21 | 16 |
| 17 | 🇸🇦 Saudi Arabia | 26 | 24 | 32 | 24 |
| 18 | 🇨🇿 Czech Republic | 33 | 33 | 34 | 26 |
| 19 | 🇦🇺 Australia | 18 | 18 | 22 | 19 |
| 20 | 🇱🇺 Luxembourg | 12 | 15 | 12 | 13 |
| 21 | 🇨🇳 China | 14 | 20 | 16 | 17 |
| 22 | 🇩🇪 Germany | 17 | 17 | 15 | 15 |
| 23 | 🇮🇱 Israel | 24 | 26 | 27 | 25 |
| 24 | 🇦🇹 Austria | 19 | 16 | 19 | 20 |
| 25 | 🇧🇭 Bahrain | N/A | N/A | N/A | 30 |
| 26 | 🇪🇪 Estonia | 35 | 28 | 26 | 22 |
| 27 | 🇲🇾 Malaysia | 22 | 27 | 25 | 32 |
| 28 | 🇰🇷 South Korea | 28 | 23 | 23 | 27 |
| 29 | 🇬🇧 UK | 23 | 19 | 18 | 23 |
| 30 | 🇹🇭 Thailand | 25 | 29 | 28 | 33 |
| 31 | 🇳🇿 New Zealand | 21 | 22 | 20 | 31 |
| 32 | 🇱🇹 Lithuania | 29 | 31 | 30 | 29 |
| 33 | 🇫🇷 France | 31 | 32 | 29 | 28 |
| 34 | 🇮🇩 Indonesia | 32 | 40 | 37 | 44 |
| 35 | 🇯🇵 Japan | 30 | 34 | 31 | 34 |
| 36 | 🇪🇸 Spain | 36 | 36 | 39 | 36 |
| 37 | 🇰🇿 Kazakhstan | 34 | 42 | 35 | 43 |
| 38 | 🇰🇼 Kuwait | N/A | N/A | N/A | N/A |
| 39 | 🇵🇹 Portugal | 39 | 37 | 36 | 42 |
| 40 | 🇮🇳 India | 43 | 43 | 43 | 37 |
| 41 | 🇮🇹 Italy | 44 | 44 | 41 | 41 |
| 42 | 🇸🇮 Slovenia | 37 | 35 | 40 | 38 |
| 43 | 🇵🇱 Poland | 38 | 39 | 47 | 50 |
| 44 | 🇨🇱 Chile | 42 | 38 | 44 | 45 |
| 45 | 🇨🇾 Cyprus | 41 | 30 | 33 | 40 |
| 46 | 🇭🇺 Hungary | 47 | 47 | 42 | 39 |
| 47 | 🇹🇷 Türkiye | 51 | 46 | 51 | 52 |
| 48 | 🇷🇴 Romania | 49 | 51 | 48 | 51 |
| 49 | 🇬🇷 Greece | 58 | 49 | 46 | 47 |
| 50 | 🇭🇷 Croatia | 60 | 60 | 59 | 46 |
| 51 | 🇱🇻 Latvia | 40 | 41 | 38 | 35 |
| 52 | 🇵🇭 Philippines | 46 | 45 | 52 | 48 |
| 53 | 🇸🇰 Slovak Republic | 53 | 57 | 50 | 49 |
| 54 | 🇯🇴 Jordan | 57 | 58 | 49 | 56 |
| 55 | 🇵🇪 Peru | 55 | 52 | 58 | 54 |
| 56 | 🇲🇽 Mexico | 50 | 53 | 55 | 55 |
| 57 | 🇧🇬 Bulgaria | 48 | 48 | 53 | 53 |
| 58 | 🇨🇴 Colombia | 52 | 54 | 56 | 57 |
| 59 | 🇧🇼 Botswana | N/A | N/A | 61 | 58 |
| 60 | 🇧🇷 Brazil | 59 | 56 | 57 | 59 |
| 61 | 🇿🇦 South Africa | 56 | 59 | 62 | 60 |
| 62 | 🇲🇳 Mongolia | 62 | 61 | 60 | 61 |
| 63 | 🇦🇷 Argentina | 61 | 62 | 63 | 62 |
| 64 | 🇻🇪 Venezuela | 63 | 63 | 64 | 63 |
Close behind in second place is Ireland, jumping five spots since 2019. The country’s strong economic performance helped it break into the upper echelon after bouncing around the top-15 rankings in the last few years.
Ranked third is Switzerland which has been in the top five since 2018, and reached first place in 2021. While the country scores well on several key indicators, it loses points on subfactors like the lack of business development and IPO offerings.
Singapore, which also was previously ranked as the most competitive country in 2019 and 2020, secured fourth place in 2023. In contrast to Denmark and Switzerland, the Asian financial heavyweight scores well on economic performance but loses ground on government efficiency.
At the bottom of the list, Venezuela, Argentina, and Mongolia face significant challenges in business competitiveness in 2023. These countries suffer from a trifecta of poor economic performance, low business and government efficiency, and substandard infrastructure, hindering business growth and development. Macro developments also play a key factor in their fortunes. For example, Mongolia has suffered in the aftermath of sanctions on Russia, a key trade partner.
Changing Rankings for the Most Competitive Countries
Though some countries have placed consistently in the rankings of the most competitive countries, there are also countries that have seen more noteworthy fluctuations.
China and Germany were both in the top 20 rankings pretty consistently until 2022, but both fell just short of that benchmark in the 2023 rankings.
And the U.S. is still in the top 10 but has dropped six spots compared to other economies in the last five years. The country’s economic might is unimpeachable, but rankings slipped in the business landscape and government efficiency metrics.
Here are the five-year changes in rankings for all countries scored in the IMD report, sorted from biggest increase to largest decrease:
| Country | Change (2019-2023) | Rank (2023) |
|---|---|---|
| 🇨🇿 Czech Republic | +15 | 18 |
| 🇧🇪 Belgium | +14 | 13 |
| 🇹🇼 Taiwan | +10 | 6 |
| 🇭🇷 Croatia | +10 | 50 |
| 🇸🇦 Saudi Arabia | +9 | 17 |
| 🇪🇪 Estonia | +9 | 26 |
| 🇬🇷 Greece | +9 | 49 |
| 🇩🇰 Denmark | +7 | 1 |
| 🇮🇪 Ireland | +5 | 2 |
| 🇫🇮 Finland | +4 | 11 |
| 🇮🇸 Iceland | +4 | 16 |
| 🇹🇷 Türkiye | 4 | 47 |
| 🇮🇳 India | 3 | 40 |
| 🇮🇹 Italy | 3 | 41 |
| 🇯🇴 Jordan | 3 | 54 |
| 🇨🇭 Switzerland | +1 | 3 |
| 🇳🇱 Netherlands | +1 | 5 |
| 🇸🇪 Sweden | +1 | 8 |
| 🇮🇱 Israel | +1 | 23 |
| 🇭🇺 Hungary | +1 | 46 |
| 🇷🇴 Romania | +1 | 48 |
| 🇰🇷 South Korea | 0 | 28 |
| 🇪🇸 Spain | 0 | 36 |
| 🇵🇹 Portugal | 0 | 39 |
| 🇸🇰 Slovak Republic | 0 | 53 |
| 🇵🇪 Peru | 0 | 55 |
| 🇲🇳 Mongolia | 0 | 62 |
| 🇦🇺 Australia | -1 | 19 |
| 🇧🇷 Brazil | -1 | 60 |
| 🇻🇪 Venezuela | -1 | 64 |
| 🇶🇦 Qatar | -2 | 12 |
| 🇨🇦 Canada | -2 | 15 |
| 🇫🇷 France | -2 | 33 |
| 🇮🇩 Indonesia | -2 | 34 |
| 🇨🇱 Chile | -2 | 44 |
| 🇦🇷 Argentina | -2 | 63 |
| 🇸🇬 Singapore | -3 | 4 |
| 🇳🇴 Norway | -3 | 14 |
| 🇱🇹 Lithuania | -3 | 32 |
| 🇰🇿 Kazakhstan | -3 | 37 |
| 🇨🇾 Cyprus | -4 | 45 |
| 🇭🇰 Hong Kong | -5 | 7 |
| 🇦🇪 UAE | -5 | 10 |
| 🇩🇪 Germany | -5 | 22 |
| 🇦🇹 Austria | -5 | 24 |
| 🇲🇾 Malaysia | -5 | 27 |
| 🇹🇭 Thailand | -5 | 30 |
| 🇯🇵 Japan | -5 | 35 |
| 🇸🇮 Slovenia | -5 | 42 |
| 🇵🇱 Poland | -5 | 43 |
| 🇿🇦 South Africa | -5 | 61 |
| 🇺🇸 U.S. | -6 | 9 |
| 🇬🇧 UK | -6 | 29 |
| 🇵🇭 Philippines | -6 | 52 |
| 🇲🇽 Mexico | -6 | 56 |
| 🇨🇴 Colombia | -6 | 58 |
| 🇨🇳 China | -7 | 21 |
| 🇱🇺 Luxembourg | -8 | 20 |
| 🇧🇬 Bulgaria | -9 | 57 |
| 🇳🇿 New Zealand | -10 | 31 |
| 🇱🇻 Latvia | -11 | 51 |
| 🇧🇭 Bahrain | N/A | 25 |
| 🇰🇼 Kuwait | N/A | 38 |
| 🇧🇼 Botswana | N/A | 59 |
The Czech Republic and Belgium have made huge strides in improving their business environments since 2019, moving up 15 and 14 spots in the rankings over the last half a decade, respectively.
Saudi Arabia has also been making steady gains thanks to a series of pro-business reforms in recent years. Together with the Czech Republic, 2023 marked the first year both countries cracked the top 20 list for the most competitive countries.
On the other hand, Latvia and New Zealand have slipped the most in competitiveness, dropping 11 and 10 spots respectively. Latvia and its Baltic neighbors are dealing with a tough geopolitical environment and risk of a recession with instability in the region, while New Zealand was noted as dealing with both a brain drain and a lack of resiliency to climate change.
An Examination of Business Competitiveness
Business competitiveness is one of many measurements for country performance, including gross domestic product (GDP), income, livability, and even happiness rankings.
And as with other measurements, it is important to consider the nuances and disparities among countries when applying a one-size-fits-all ranking system.
For instance, the most populous countries rank comparatively poorer. The U.S. ranks #2 when only considering countries with a population greater than 20 million, and China is the most competitive country with a GDP per capita of less than $20,000.
And while criticisms about the subjectivity of these rankings may be valid, looking at these kinds of breakdowns can bring unique insights to broad sociological questions, and be used as a tool to help policymakers.
Where Does This Data Come From?
Source: The International Institute for Management Development’s World Competitiveness Booklet 2023.

This article was published as a part of Visual Capitalist's Creator Program, which features data-driven visuals from some of our favorite Creators around the world.


Stocks
The 50 Best One-Year Returns on the S&P 500 (1980-2022)
The highest one-year return among the top S&P 500 stocks from 1980 to 2022 was a staggering 2,620%. Which stocks top the ranks?

The Top S&P 500 Stocks by Annual Returns
The average annual return of the S&P 500 was 10% from 1980-2022, excluding dividends. Of course, there are some companies that deliver much higher returns in any given year.
In this graphic using data from S&P Dow Jones Indices, we explore the top S&P 500 stocks with the best single year returns over the last four decades.
Ranking the Top S&P 500 Stocks
In order to find the top gainers, S&P took the top 10 best-performing stocks each year and then narrowed that list down to the top 50 overall. They ranked the top S&P 500 stocks by price returns, meaning that no dividends or stock distributions were included.
The best gains were clustered in a few select years, including the 1999 dot-com boom, the 2003 stock market rally, and the 2009 recovery from the Global Financial Crisis. None of the biggest gains happened in 2021 or 2022.
| Rank | Company | Sector | Return | Year |
|---|---|---|---|---|
| 1 | Qualcomm | Information Technology | 2620% | 1999 |
| 2 | Tesla | Consumer Discretionary | 743% | 2020 |
| 3 | DSC Communications | Communication Services | 468% | 1992 |
| 4 | Coleco Industries | Consumer Discretionary | 435% | 1982 |
| 5 | Avaya | Information Technology | 428% | 2003 |
| 6 | Chrysler | Consumer Discretionary | 426% | 1982 |
| 7 | XL Capital (Axa XL) | Financials | 395% | 2009 |
| 8 | Tenet Healthcare | Healthcare | 369% | 2009 |
| 9 | Dynegy | Utilities | 361% | 2000 |
| 10 | Advanced Micro Devices | Information Technology | 348% | 2009 |
| 11 | Sprint | Communication Services | 343% | 1999 |
| 12 | Ford | Consumer Discretionary | 337% | 2009 |
| 13 | NEXTEL Communications | Communication Services | 336% | 1999 |
| 14 | LSI Logic | Information Technology | 319% | 1999 |
| 15 | NVIDIA | Information Technology | 308% | 2001 |
| 16 | Nortel Networks | Communication Services | 304% | 1999 |
| 17 | Etsy | Consumer Discretionary | 302% | 2020 |
| 18 | Genworth Financial | Financials | 301% | 2009 |
| 19 | Micron Technology | Information Technology | 300% | 2009 |
| 20 | NetFlix | Communication Services | 298% | 2013 |
| 21 | Oracle | Information Technology | 290% | 1999 |
| 22 | Western Digital | Information Technology | 286% | 2009 |
| 23 | Network Appliance (NetApp) | Information Technology | 270% | 1999 |
| 24 | Data General | Information Technology | 267% | 1991 |
| 25 | Yahoo | Communication Services | 265% | 1999 |
| 26 | Williams Companies | Energy | 264% | 2003 |
| 27 | Novell | Information Technology | 264% | 1991 |
| 28 | Dynegy | Utilities | 263% | 2003 |
| 29 | Sun Microsystems | Information Technology | 262% | 1999 |
| 30 | PMC-Sierra | Information Technology | 262% | 2003 |
| 31 | Advanced Micro Devices | Information Technology | 259% | 1991 |
| 32 | Dell | Information Technology | 248% | 1998 |
| 33 | Global Marine | Energy | 247% | 1980 |
| 34 | Micron Technology | Information Technology | 243% | 2013 |
| 35 | Best Buy | Consumer Discretionary | 237% | 2013 |
| 36 | Reebok | Consumer Discretionary | 234% | 2000 |
| 37 | Freeport-McMoRan | Materials | 229% | 2009 |
| 38 | Biomet (Zimmer Biomet) | Healthcare | 226% | 1991 |
| 39 | NVIDIA | Information Technology | 224% | 2016 |
| 40 | Gap | Consumer Discretionary | 223% | 1991 |
| 41 | NetFlix | Communication Services | 219% | 2010 |
| 42 | Fleetwood Enterprises (Fleetwood RV) | Consumer Discretionary | 217% | 1982 |
| 43 | National Semiconductor | Information Technology | 217% | 1999 |
| 44 | Dell | Information Technology | 216% | 1997 |
| 45 | Tandy Corp (RadioShack) | Information Technology | 216% | 1980 |
| 46 | Novell | Information Technology | 215% | 2003 |
| 47 | Corning | Information Technology | 215% | 2003 |
| 48 | CB Richard Ellis (CBRE) | Real Estate | 214% | 2009 |
| 49 | AES Corp | Utilities | 213% | 2003 |
| 50 | Expedia | Consumer Discretionary | 212% | 2009 |
Qualcomm was by far the top-performer in any one calendar year window. The company had key patents for Code Division Multiple Access (CDMA) technology, which enabled fast wireless internet access and became the basis for 3G networks.
Its stock took off in 1999 as it shed less profitable business lines, resolved a patent dispute with competitor Ericsson, and joined the S&P 500 Index. At the time, CNN reported that one lucky investor who heard about Qualcomm from an investment-banker-turned-rabbi earned $17 million—roughly $30 million in today’s dollars.
The most recent stocks to make the rankings were both from 2020: well-known Tesla (#2) and lesser-known online marketplace Etsy (#17), which saw sales from independent creators surge during the early COVID-19 pandemic. The dollar value of items sold on Etsy more than doubled from $5.3 billion in 2019 to $10.3 billion in 2020, with mask sales accounting for 7% of the total.
Biggest Gainers in Each Sector
While information technology stocks made up nearly half of the list, there is representation from nine of the 11 S&P 500 sectors. No companies from the Industrials or Consumer Staples sectors made it into the ranks of the top S&P 500 stocks by annual returns.
Below, we show the stock with the best annual return for each sector.

Tesla was the top-performing Consumer Discretionary stock on the list. After meeting the requirement of four consecutive quarters of positive earnings, it joined the S&P 500 Index on December 21, 2020. The company’s performance was boosted by the announcement that it would be included in the S&P 500, along with strong performance in China, and general EV buzz as environmental regulations tightened worldwide.
In the realm of Communication Services, DSC Communications saw a sizable return in 1992. The telecommunications equipment company had contracts with major companies such as Bell and Motorola. Alcatel-Lucent (then Alcatel), a French producer of mobile phones, purchased DSC Communications in 1998.
Serial Success Stories
It’s impressive to make the list of the top S&P 500 stocks by calendar returns once, but there are seven companies that have done it twice.
Some stocks saw their repeated outperformance close together, with Dell making the ranks back-to-back in 1997 and 1998.

On the other hand, a select few have more staying power. Computing giant NVIDIA topped the charts in 2001 and triumphed again 15 years later in 2016. And this year might be another win, as the company has recently reached a $1 trillion market capitalization and has the highest year-to-date return in the S&P 500 as of July 6, 2023.
-

 Investor Education4 weeks ago
Visualizing BlackRock’s Top Equity Holdings
-

 apps2 weeks ago
Meet the Competing Apps Battling for Twitter’s Market Share
-

 Politics14 hours ago
How Do Chinese Citizens Feel About Other Countries?
-

 Markets4 weeks ago
Visualizing Every Company on the S&P 500 Index
-

 Markets2 weeks ago
Visualizing 1 Billion Square Feet of Empty Office Space
-

 Energy4 weeks ago
Life Cycle Emissions: EVs vs. Combustion Engine Vehicles
-

 Maps2 weeks ago
Vintage Viz: The World’s Rivers and Lakes, Organized Neatly
-

 Markets3 weeks ago
Visualized: The 100 Largest U.S. Banks by Consolidated Assets